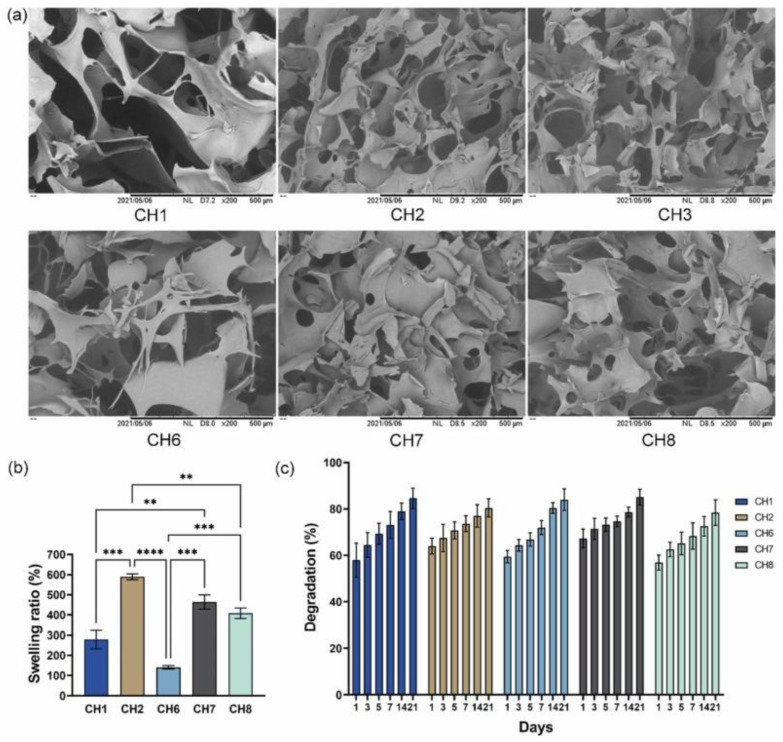
Figure 4.
(a) Scanning electron microscopy (SEM) images, (b) swelling ratio (%), and (c) enzymatic degradation (%) of chitosan/β-GP hydrogels. Data was analyzed by one-way ANOVA and Tukey’s test where p ≤ 0.01 **, p ≤ 0.001 ***, and p ≤ 0.001 ****. Reprinted from Bhuiyan et al. [103], copyright 2023, with permission of Elsevier.

