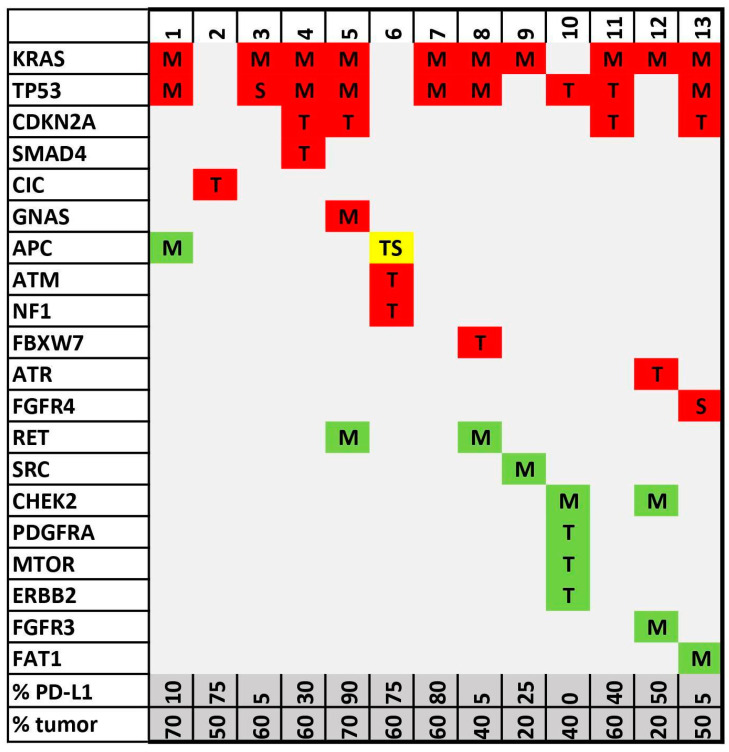
Figure 1.
NGS oncoprint diagram shows detected alteration spectra in the analyzed sample set. Genes are sorted according to the number of detected alterations in the vertical columns and sample IDs in the horizontal rows. Alterations are indicated by a standard variant naming algorithm: T = truncating variant (including frameshift); M = oncogenic missense variant; S = oncogenic splicing variant. Red—pathogenic/likely pathogenic; green—variant of unknown significance (VUS); yellow—one pathogenic mutation and the other VUS. PD-L1 tumor proportion score (TPS) and percentage of tumor cells in NGS sample assessed by pathologist are presented in two bottom lines.

