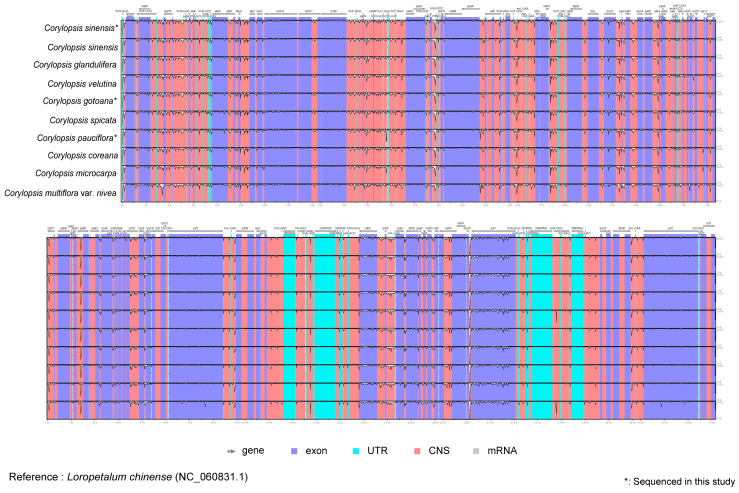
Figure 2.
Using mVISTA plots, the alignment of plastid genome sequences was conducted to evaluate the percent sequence identity of the plastid genomes of 10 Corylopsis species, with Loropetalum chinense (NC_060831.1) serving as the reference. The x-axis represents the coordinate in the plastid genome, while the y-axis represents the average percentage of sequence similarity in the aligned regions, which ranges from 50% to 100%. Genome regions are categorized as protein-coding, rRNA-coding, tRNA-coding, or conserved noncoding sequences (CNS).

