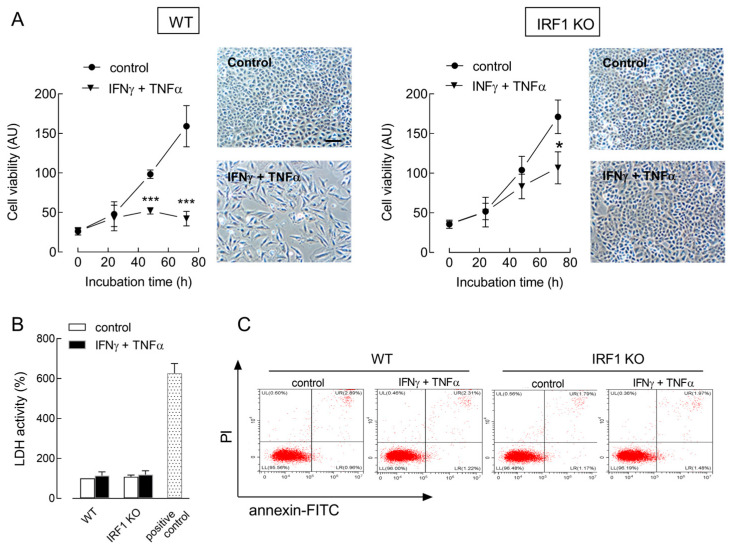
Figure 2.
Effect of cytomix on the proliferation of A549 WT and IRF1 KO cells. Cells were incubated in the absence (control) or in the presence of 10 ng/mL INFγ + 50 ng/mL TNFα (cytomix). Panel (A): At the indicated times, cell viability was determined with the resazurin assay, as described in Methods. * p < 0.05, *** p < 0.001 vs. control with Student’s t-test. Representative images of cell cultures treated for 72 h are shown; bar = 100 µM. Panel (B): LDH activity was determined after 72 h as described in Methods. Data are expressed as a percent of the control cell activity. A positive control of necrotic cells, obtained with a 24 h exposure to 1 µM staurosporine, is shown. Data are the mean ± SD of four determinations in a representative experiment, which, repeated three times, gave comparable results. Panel (C): After 24 h, apoptotic cell death was evaluated with flow cytometry through Annexin V-FITC/Propidium iodide staining, as detailed in Methods. Flow cytometry graphs in a representative experiment are shown. The experiment was repeated three times with comparable results.

