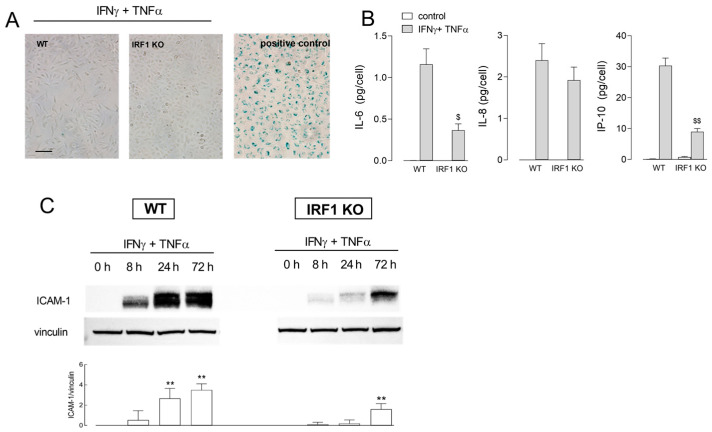
Figure 4.
Effect of INFγ + TNFα on the induction of a senescent phenotype in A549 WT and IRF1 KO. Cells were incubated for 72 h in the absence (control) or in the presence of 10 ng/mL INFγ + 50 ng/mL TNFα. Panel (A): Cellular senescence was assessed with β-galactosidase staining. Representative images are shown with a positive control represented by endothelial cells (HUVECs) maintained in culture for 10 passages. Panel (B): The amount of the indicated cytokines was measured with an ELISA assay, as described in Methods. Data are means ± SEM of three independent experiments, each performed in triplicate. $ p < 0.05, $$ p < 0.01 vs. WT cells with Student’s t-test. Panel (C): ICAM-1 protein was assessed by means of Western Blot analysis at the indicated times of treatment, as detailed in Methods. Representative blots are shown along with mean ± SEM of the densitometric analysis of three different experiments. ** p < 0.01 vs. 0 h (untreated cells) with One way ANOVA.

