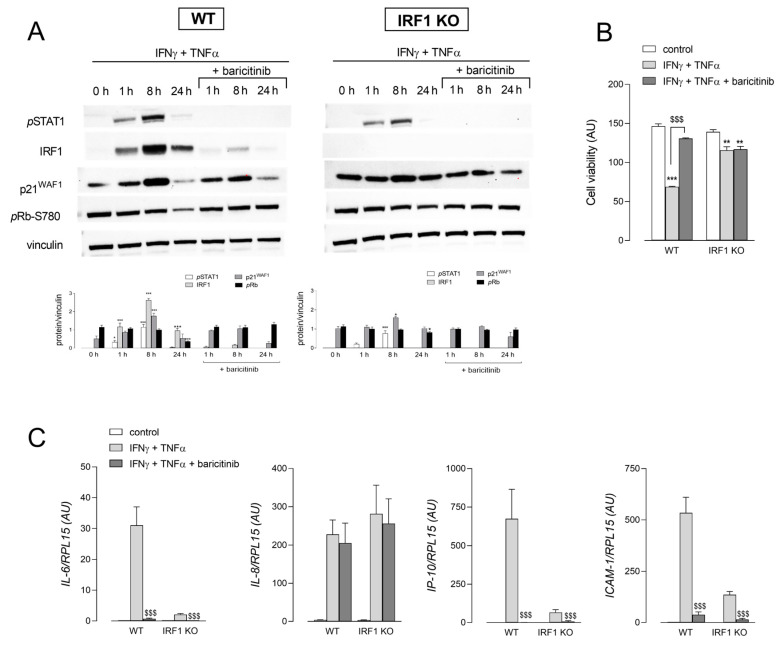
Figure 5.
Effect of baricitinib on the cytomix-induced expression of senescence markers. Panel (A): The cells were incubated in the absence (0 h) or in the presence of 10 ng/mL INFγ + 50 ng/mL TNFα for the indicated times; 1 µM baricitinib was added 1 h before the treatment and maintained throughout the incubation. The expression of the indicated proteins was assessed by means of Western Blot analysis, as detailed in Methods. Representative blots are shown along with mean ± SEM of the densitometric analysis of three different experiments. * p < 0.05, *** p < 0.001 vs. 0 h (untreated cells) with One-way ANOVA. Panel (B): After 72 h of treatment, cell viability was assessed through resazurin assay, as described in Methods. Each point is the mean ± SD of four determinations in a representative experiment that, repeated three times, gave comparable results. ** p < 0.01, *** p < 0.001 vs. control; $$$ p < 0.001 vs. INFγ + TNFα with Student’s t-test. Panel (C): The expression of the indicated genes was measured after 24 h of incubation under the indicated conditions by means of RT-qPCR, as described in Methods. Bars are means ± SEM of three independent experiments, each performed in duplicate. $$$ p < 0.001 vs. INFγ + TNFα with Student’s t-test.

