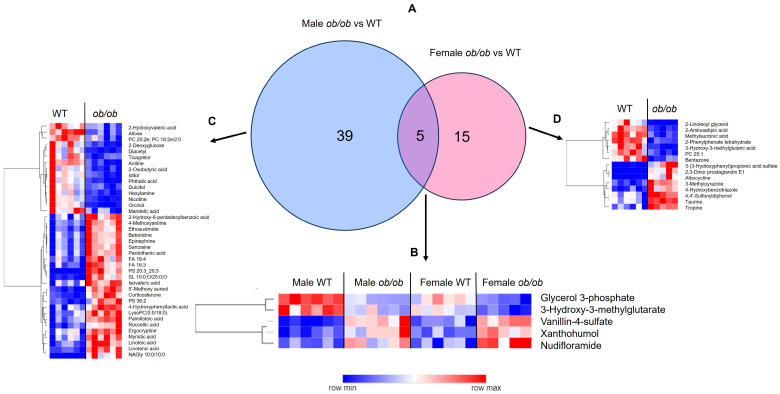
Figure 2.
The majority of metabolites altered by obesity are sex-dependent. (A) Venn diagram comparison of metabolites significantly different by genotype (ob/ob vs. wild-type (WT)) between males and females. Heatmaps of metabolites common to males and females (B), specific to males (C), and specific to females (D). In all heatmaps, dark blue represents lower levels, dark red represents higher levels, and lighter shades indicate intermediate levels of metabolites, as indicated in the color bar.

