Figure 4.
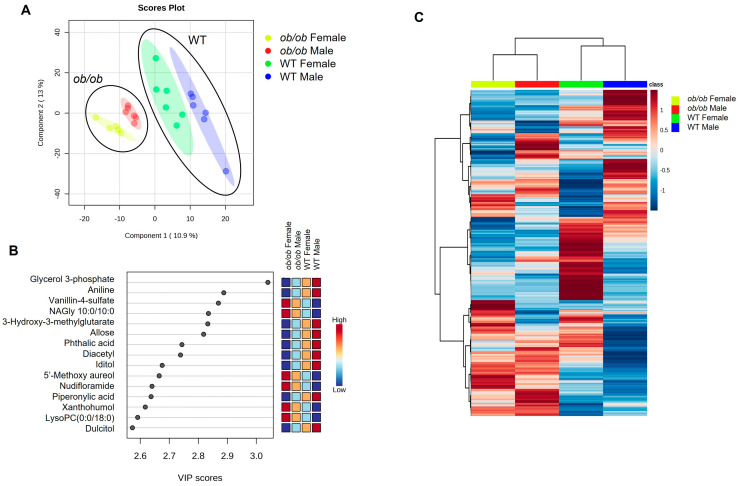
Obesity has a stronger effect on the brain metabolome than biological sex, as shown by partial least squares-discriminate analyses (PLS-DA) and hierarchical clustering. (A) PLS-DA of ob/ob and wild-type (WT) male and female brain metabolic profiles. Small circles represent individual mouse brain samples, while the larger shaded region of the same color represents the 95% confidence interval of the group. Black circles group samples of the same genotype for ease of visualization. (B) Variable importance projection (VIP) scores of top 15 variables for component 1. (C) Hierarchical clustering heatmap of group averages of ob/ob and WT male and female metabolites. Dark blue represents lower levels, dark red represents higher levels, and lighter shades indicate intermediate levels of metabolites, as indicated in the color bar.

