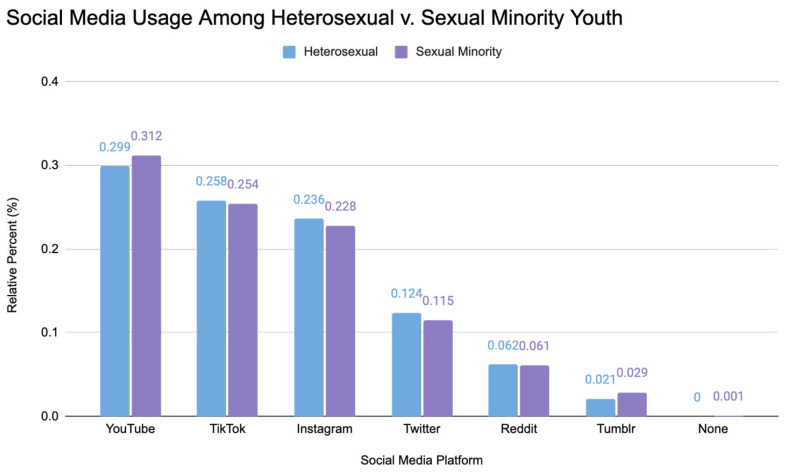
Figure 1.
Social media usage among heterosexual v. sexual minority youth. This bar chart illustrates the relative percentages of heterosexual and sexual minority youth engaging with various social media platforms. The percentages are calculated based on the total number of individuals for their respective group for each platform.

