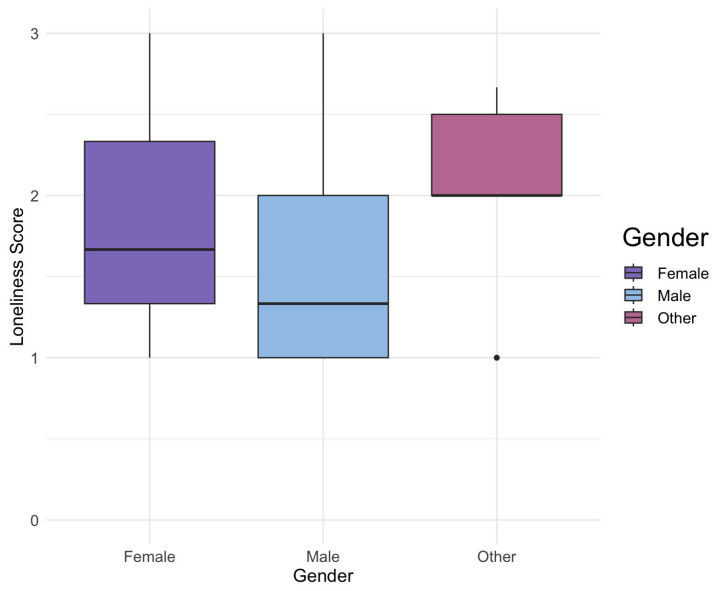
Figure 3.
Distribution of loneliness scores across gender categories for sexual minority youth. This graphic presents three boxplots illustrating the distribution of loneliness scores across different gender categories—female, male, and other. The visual representation underscores noticeable distinctions: the other category exhibits less variability, with a concentration in higher loneliness scores, while both male and female categories display greater variability. Additionally, the mean loneliness score for females surpasses that of males.

