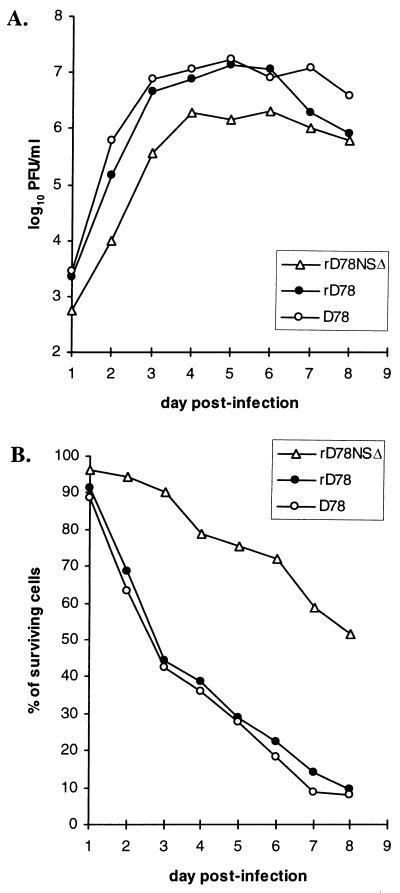
FIG. 3.
Growth curve of IBDV (A) and cytotoxic effect in IBDV-infected cells (B). (A) Monolayers of CEF cells were infected with the indicated viruses at an MOI of 0.1 and harvested at the indicated time points, and infectious titers were determined by plaque assay. (B) Cell cultures were assayed for viability at the indicated times by the MTT assay. The mean of the OD value ≥1.0 unit above that of control wells at each day was defined as 100% cell survival. Each value is the average of two independent experiments.

