Figure 2.
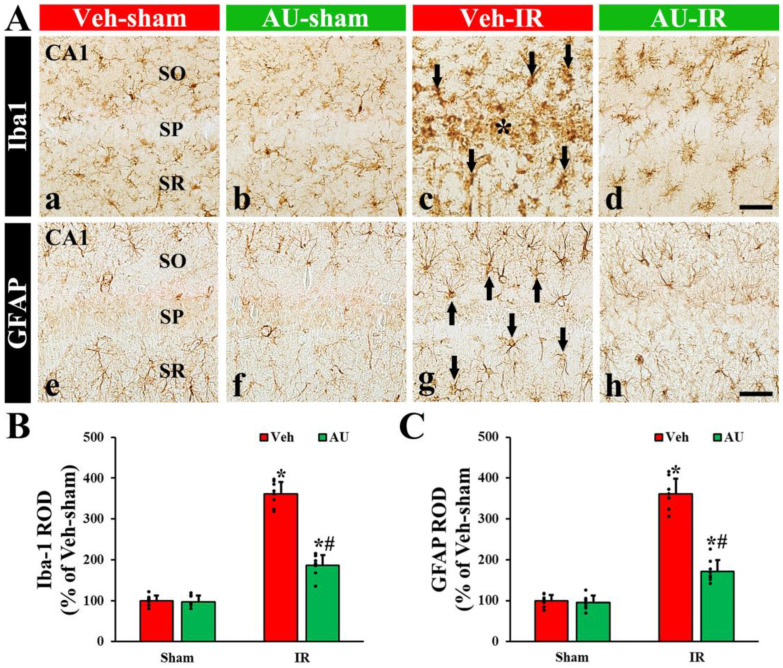
(A) Representative photomicrographs of Iba1 (upper panels) and GFAP immunohistochemistry (lower panels) in the CA1 field of the Veh-sham (a,e), AU-sham (b,f), Veh-IR (c,g), and AU-IR (d,h) groups at 4 days after cerebral IR. No significant differences in the morphology of Iba1+ and GFAP+ glial cells are observed between the Veh-sham and AU-sham groups. In the Veh-IR group, reactive Iba1+ and GFAP+ glial cells (arrows in (c,g)) are distinctly observed: especially, many reactive Iba1+ glial cells are concentrated in the stratum pyramidale (SP, asterisk in (c)). However, in the AU-IR group, the reaction of Iba1+ and GFAP+ glial cells is apparently weakened as compared to that of the Veh-IR group. SO, stratum oriens; SR, stratum radiatum. Scale bar = 60 µm. (B,C) Quantitative analysis of Iba1+ (B) and GFAP+ (C) structures in the CA1 field. The error bars represent mean ± SD (n = 8/group; * p < 0.05 vs. corresponding sham group, # p < 0.05 vs. Veh-IR group).

