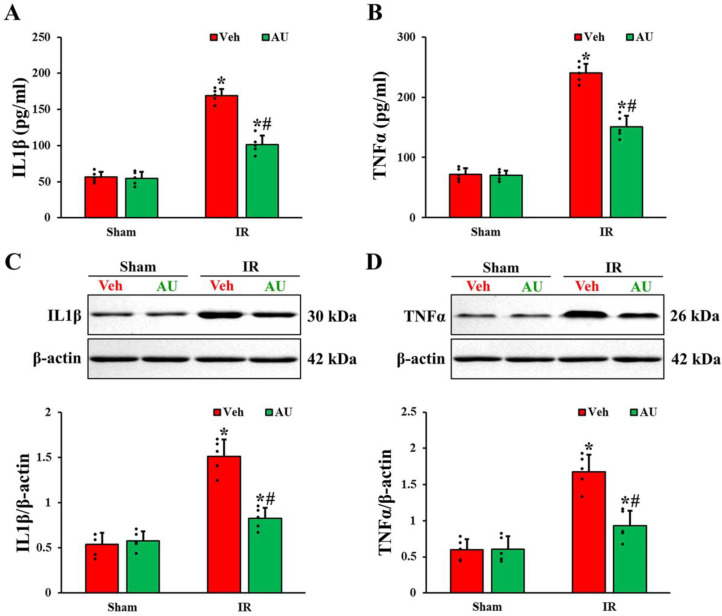
Figure 3.
(A,B) Levels of IL1β (A) and TNFα (B) in the serum of the Veh-sham, AU-sham, Veh-IR, and AU-IR groups at 1 day after cerebral IR. (C,D) Western blot bands (n = 1 per lane) and quantitative analyses of IL1β (C) and TNFα (D) in the CA1 field extracted from the Veh-sham, AU-sham, Veh-IR, and AU-IR groups at 1 day after IR. Note that Western blot bands for n = 4 are included in the Supplementary Materials Figures S1–S4. IL1β and TNFα levels in both serum and CA1 field of the Veh-IR group are enhanced, but those in the AU-IR group are low as compared to those of the Veh-IR group. The error bars represent mean ± SD (n = 5/group; * p < 0.05 vs. corresponding sham group, # p < 0.05 vs. Veh-IR group).

