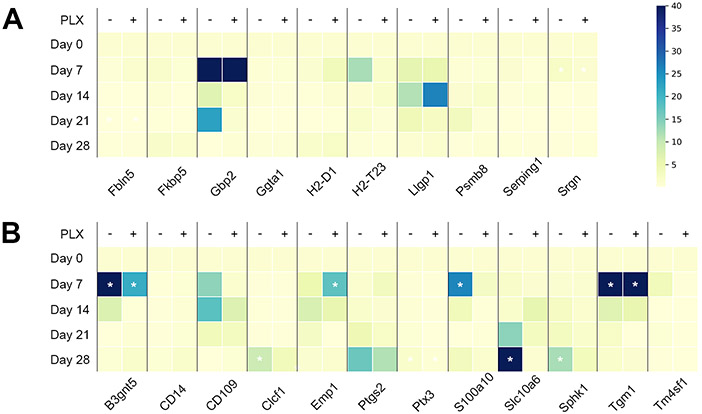
Figure 7.
Time series of A1 and A2 genes in optic nerve head astrocytes. A, genes in the “A1”, or neurotoxic group. Gpb2 was at the level of detection at day 0, but became detectable thereafter. B, genes in the “A2”, or neuroprotective group. Color bar for panels A-B, colors represent –fold expression compared to baseline (Day 0). White asterisks indicate significant differences from the baseline expression levels.

