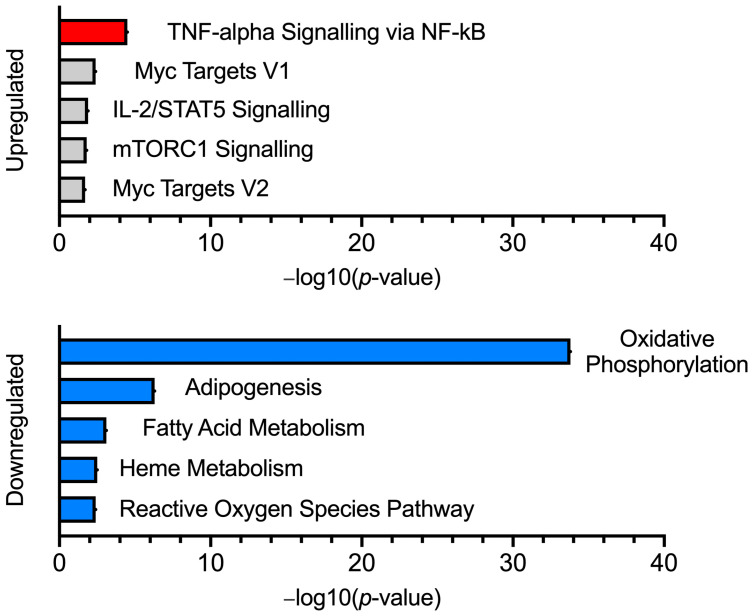
Figure 1.
Pathway analysis for MHN vs. MHS. Bar charts featuring the top 5 enriched pathway terms (up and downregulated), generated using genes differentially expressed in the MHS (Pre-IVCT) phenotype. Statistically significant pathway terms are highlighted in red (upregulated) and blue (downregulated).

