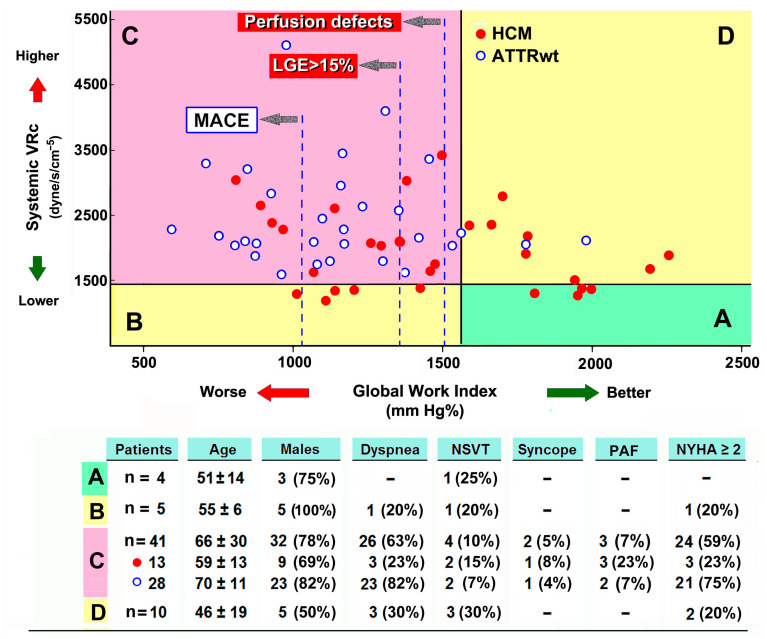
Figure 2.
Scatter plot diagram showing four classes categorized according to SVRc (cut-off 1440 dyne/cm/s−5) [3,8] and GWI (cut-off 1576 mm Hg%) [18]. Therefore, Class A included patients with low/normal SVRc and preserved GWI, then interpreted as the best functional class. Class B included patients with lower GWI and normal SVRc, taken as intermediate risk class. Class C included patients with higher SVRc and impaired GWI, then considered as the worst one. Class D, another intermediate class due to high SVRc. Vertical dashed lines indicate the cut-off values by previous studies for impaired myocardial perfusion and late gadolinium enhancement (LGE) in HCM patients [21], and major cardiovascular events (MACE) in ATTR patients [22]. Tabulation below the graphics refers to some clinical findings from the patients belonging to different Classes (see also Table 3). ATTRwt, wild-type transthyretin cardiac amyloidosis; HCM, nonobstructive hypertrophic cardiomyopathy; NYHA, New York Heart Association functional class; NSVT, nonsustained ventricular tachycardia on 24-h ECG Holter monitoring; PAF, paroxysmal atrial fibrillation.

