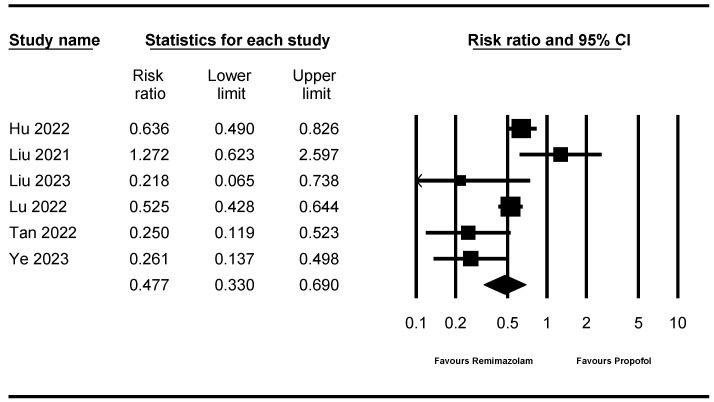
Figure 4.
Forest plot for the studies comparing the effect of remimazolam to that of propofol on the incidence of hypotension. The figure depicts individual trials as filled squares with relative sample size and the 95% confidence interval (CI) of the difference as a solid line. The diamond shape indicates the pooled estimate and uncertainty for the combined effect [10,11,13,14,15,16].

