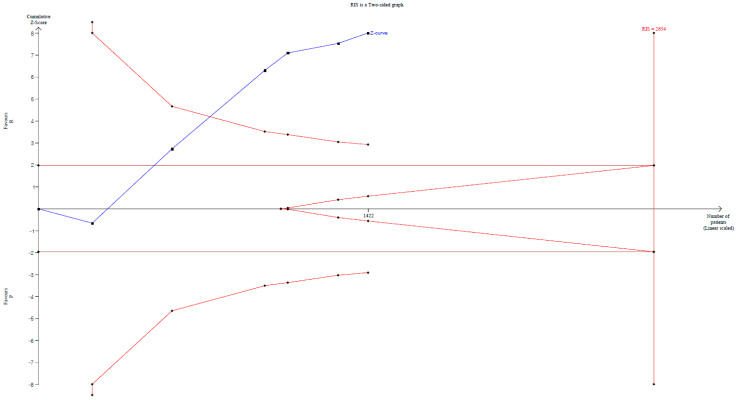
Figure 5.
Trial sequential analysis for the studies comparing the effect of remimazolam to that of propofol on the incidence of hypotension. Uppermost and lowermost curves represent trial sequential monitoring boundary lines for benefit and harm, respectively. Horizontal line represents the conventional boundaries for statistical significance. Triangular lines on the right side reflect the futility boundaries. The blue solid line represents the cumulative Z-curve. The number on the x-axis indicates required information size.

