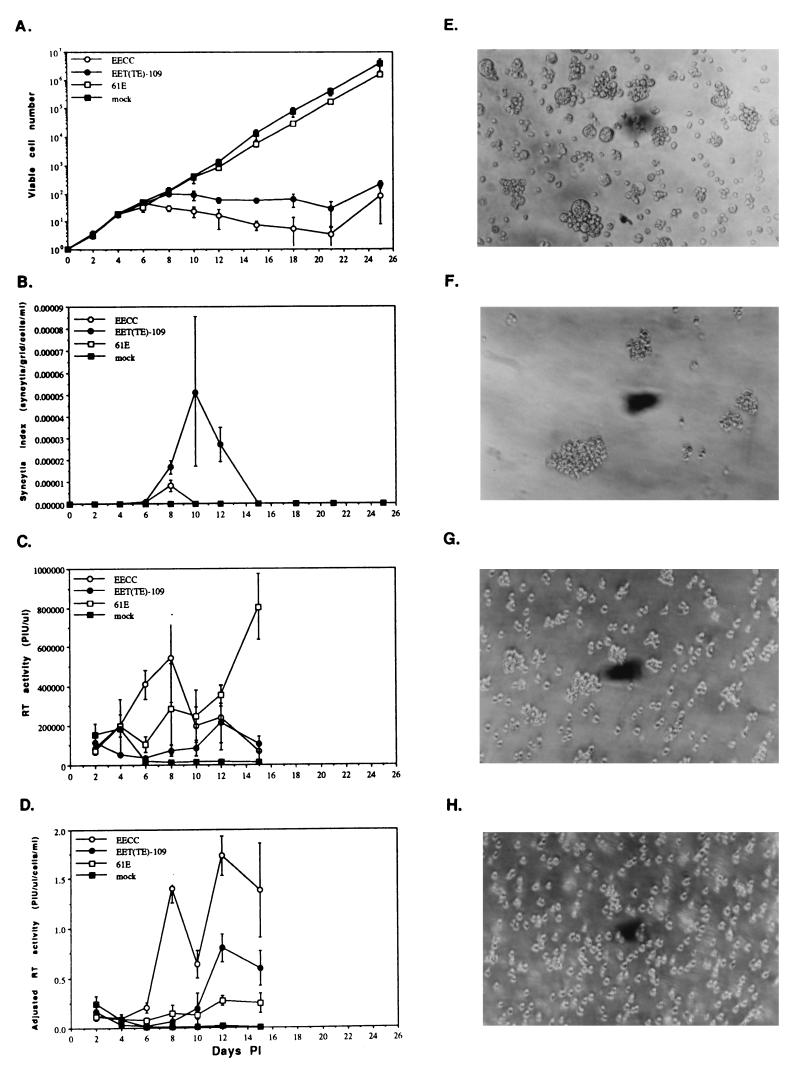
FIG. 3.
CPE and viral replication kinetics after infection of 3201 feline T cells with molecularly cloned viruses. Infection was performed in triplicate with an MOI of 0.001. All replicate values were averaged, and error bars indicate the extent of sample standard deviation. The ordinates are as follows: (A) viable cell number, as assessed by the exclusion of the vital dye trypan blue (log scale); (B) syncytium index, which is the quotient of the number of large syncytia visible in one defined field of the microscope divided by the cell density at that time point (linear scale); (C) total RT activity in the culture supernatants, expressed in terms of arbitrary adjusted PIU/microliter (linear scale); and (D) PIU/microliter, divided by the cell density to account for large differences in number of virus-producing cells in cytopathic and noncytopathic infections (linear scale). (E to H) Phase-contrast photomicrographs (magnification, ×200) showing morphological appearance of 3201 T cells infected with various FeLVs at day 8 p.i. Cultures were infected with EET(TE)-109 (E) EECC (F), or 61E (G) or were mock infected (H). The results in panels A and B and E to H are representative of six, and those in panels C and D are representative of two, similar, independent infections.

