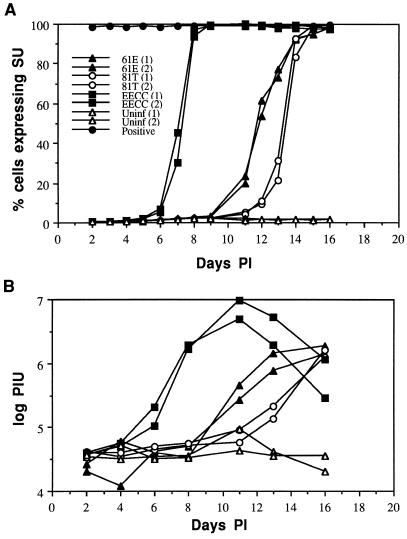
FIG. 4.
Analysis of virus spread by flow cytometric analysis of cells expressing envelope SU protein. 3201 T cells were infected with 61E, EECC, or EET(TE)-109 in duplicate. Equivalent doses of virus, as measured by RT assay, were used for all infections. (A) Cell surface expression of SU was monitored by using antibody C11D8. The percentage of cells expressing SU above background is plotted against days p.i. (B) Total RT activity in the culture supernatants, expressed in terms of arbitrary adjusted PIU/microliter (log scale), versus days p.i. The symbols corresponding to the virus used for each infection are designated in panel A and apply to the data in both panels. 81T refers to the EET(TE)-109 virus encoding the 81T envelope protein. The numbers 1 and 2 in parentheses were used to discriminate data from duplicate infections with the same virus. “Positive” in panel A represents data from a chronically 61E infected 3201 T-cell line that was used as a positive control at each time point. Data from duplicate uninfected cultures [Uninf (1) and (2)] are also shown.

