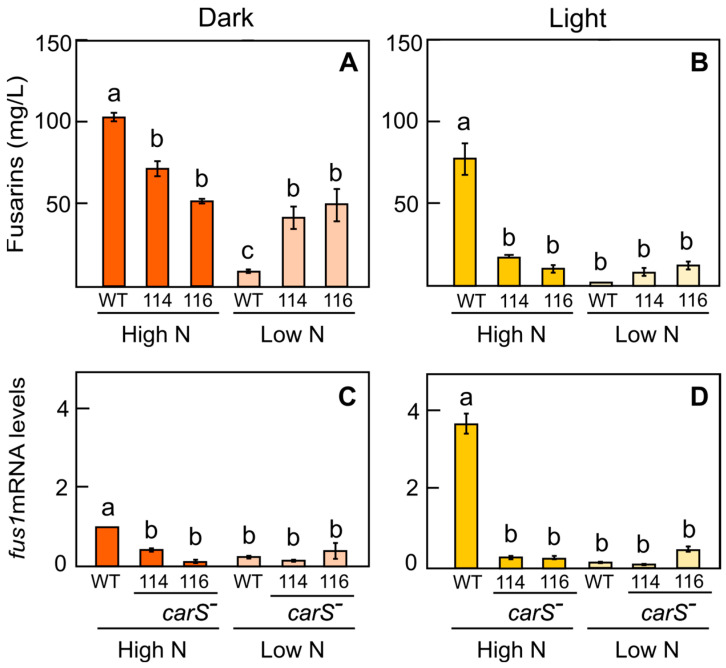
Figure 4.
Fusarin production and fus1 expression by the wild type and carS mutants SF114 and SF116, grown under different conditions of nitrogen and illumination. (A,B) Fusarins in the filtrates of 7-day-old cultures at 30 °C in minimal medium with high N (20 mM asparagine) and low N (4.2 mM asparagine) concentrations in the dark (left) and in the light (right). Data show mean and standard deviation values from two independent experiments. (C,D) Relative fus1 mRNA amounts in mycelia from the cultures whose fusarin production levels are shown in the upper graphs. Data represent mean and standard deviation values from 4 measurements from 2 independent experiments. Statistically significant differences are indicated with different letters according to the Tukey HSD test for a significance level of α = 0.05.

