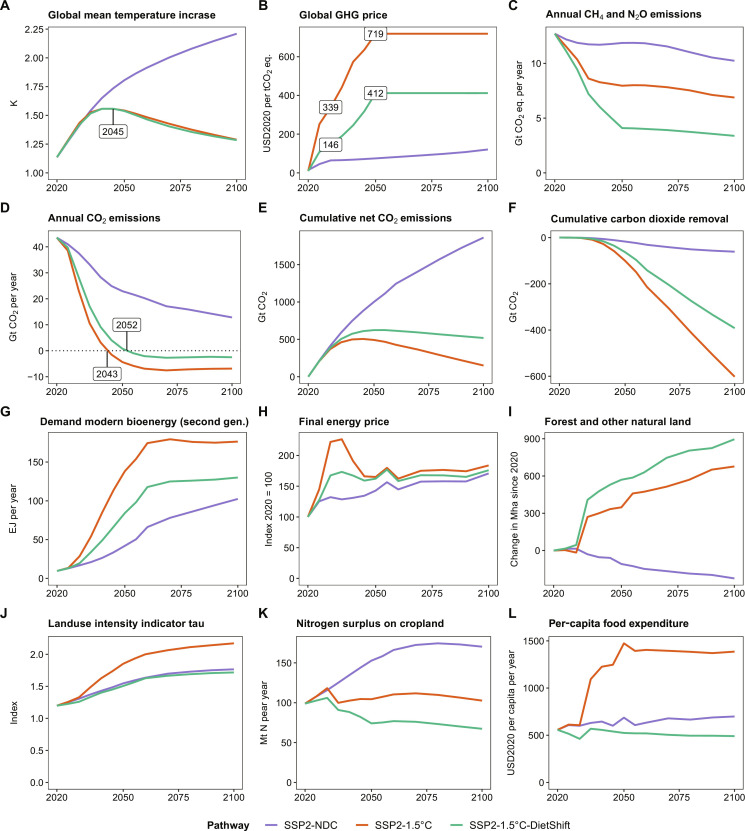
Fig. 2. Key indicators for climate, energy, and land system development in the 21st century at global level from REMIND-MAgPIE.
SSP2-NDC is shown as reference for a pathway that is not in line with the Paris Agreement. Peak global mean temperature increase (A) is identical in SSP2-1.5°C and SSP2-1.5°C-DietShift. The global GHG price (B) in SSP2-1.5°C-DietShift is 57% lower in 2030 and 43% lower in 2050 compared to SSP2-1.5°C. CH4 and N2O emissions (C) decrease considerably in SSP2-1.5°C-DietShift, which relaxes the tight constraint on the CO2 emission budget (D and E). Reliance on CDR (F) as well as demand for bioenergy (G) are lower in SSP2-1.5°C-DietShift, while final energy prices (H) increase less strongly. Forest and other natural land (I) increase stronger under SSP2-1.5°C-DietShift, while land use intensity (J) is lower and comparable to SSP2-NDC. Nitrogen surplus (K) decreases stronger in SSP2-1.5°C-DietShift and per-capita food expenditures for agricultural products (L) remain rather constant in the 21st century instead of a doubling in SSP2-1.5°C.

