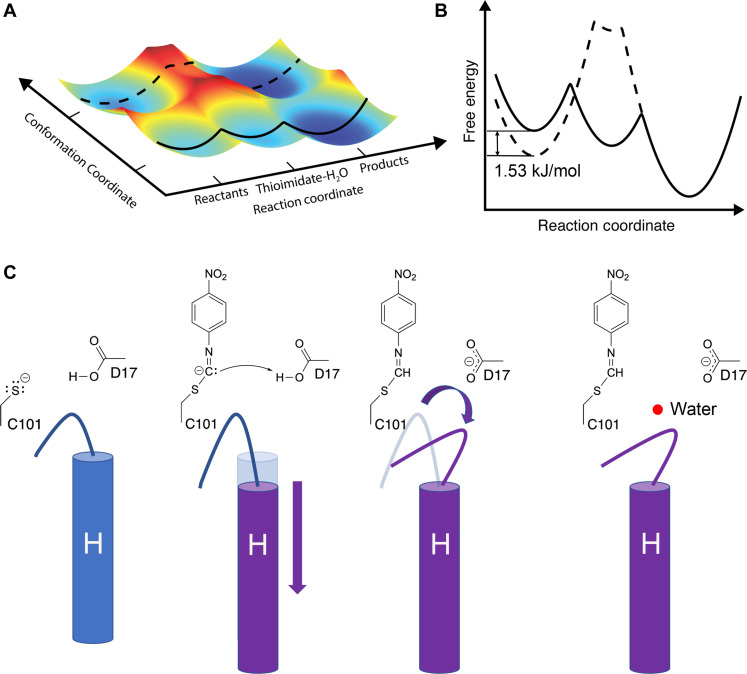
Fig. 7. Energy landscape model of ICH catalysis and charge-coupled enzyme dynamics.
(A) Plot of free energy of the two active site loop conformations versus progress along the reaction coordinate as inferred from XFEL structures. As the reaction proceeds through the intermediate, the open-loop conformation (bottom, with solid line) is energetically preferred. (B) Slices through the surface are show in a conventional two-dimensional free energy versus reaction coordinate plot. The 1.53 kJ/mol energy difference of the loop conformations in the resting enzyme is calculated from the crystallographic occupancies using the Gibbs free energy equation (see Methods). The closed-loop conformation (dotted line) has a higher energy than the open one upon intermediate formation and concomitant Asp17 ionization. (C) Schematic of the first steps in ICH catalysis. Neutralization of charge on Cys101 triggers an initial shift in helix H, followed by ionization of Asp17, causing a change in loop position that allows water (red sphere) to enter the active site and hydrolyze the intermediate.

