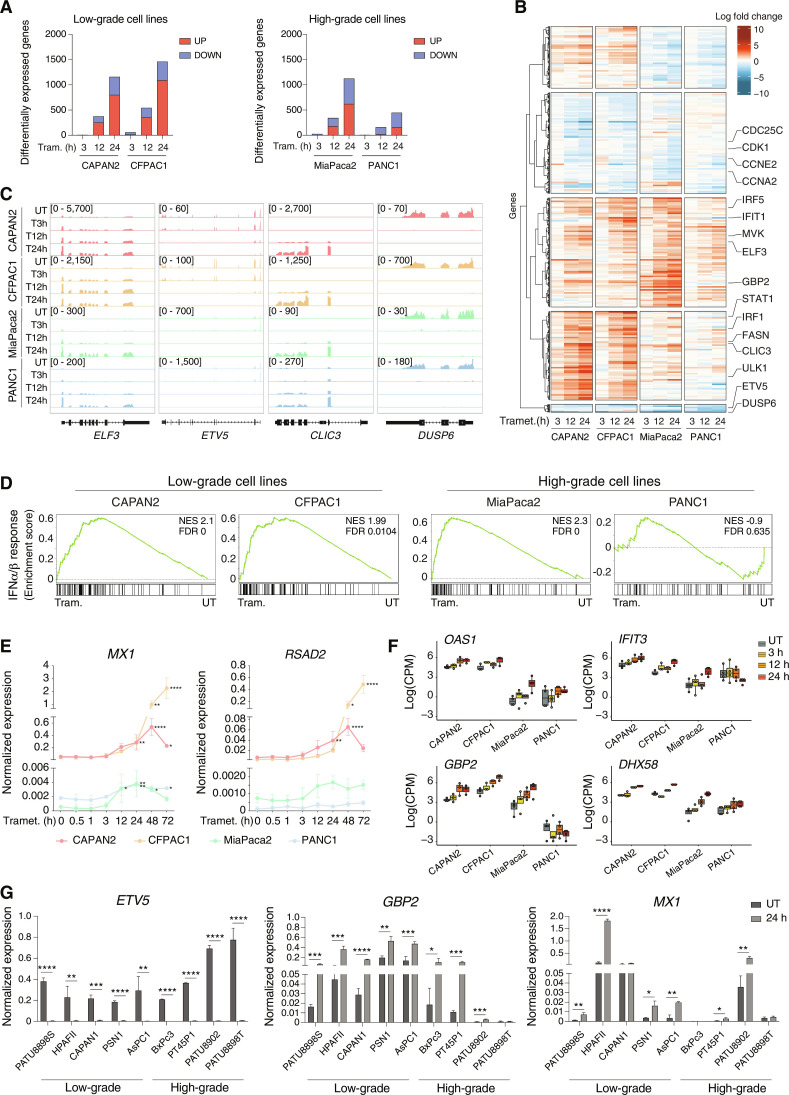
Fig. 1. Activation of the IFN response upon trametinib treatment.
(A) Bar plots showing the number of DEGs (up-regulated in red and down-regulated in blue) in low-grade (left panel) and high-grade (right panel) PDAC cell lines after trametinib treatment with respect to untreated samples. (B) DEGs in low-grade and high-grade PDAC cell lines after trametinib treatment. RNA-seq normalized counts are shown as row z scores. The number of DEGs in the five clusters shown is as follows (from top to bottom): 441, 721, 779, 633, and 57. (C) Genome browser snapshots showing RNA-seq profiles for selected up- or down-regulated genes in low- and high-grade PDAC cell lines after trametinib treatment. (D) GSEA plots showing the differential enrichment of the type I IFN signature in low- and high-grade PDAC cell lines treated with trametinib for 24 hours versus untreated (UT) cells. (E) Expression of two IFN-stimulated genes, MX1 and RSAD2, was measured by RT-qPCR during a trametinib treatment time course. Values represent 2−ΔCq relative to the reference gene (C1ORF43). n = 3 independent biological replicates. Means ± SD are shown. Significance was assessed using one-way ANOVA and indicated as follows: *P ≤ 0.05, **P ≤ 0.01, ****P ≤ 0.0001. (F) RNA-seq data counts showing the expression of selected IFN-regulated genes in low- and high-grade PDAC cell lines. Data are reported as the log of count per million (CPM) after TMM normalization with EdgeR. (G) RT-qPCR analysis of the ETV5, GBP2, and MX1 genes in a panel of human PDAC cell lines after treatment with trametinib or vehicle for 24 hours. Values represent 2−ΔCq relative to C1ORF43. n = 3 independent biological replicates. Means ± SD are shown. Significance was assessed using t test and indicated as follows: *P ≤ 0.05, **P ≤ 0.01, ***P ≤ 0.001, ****P ≤ 0.0001.

