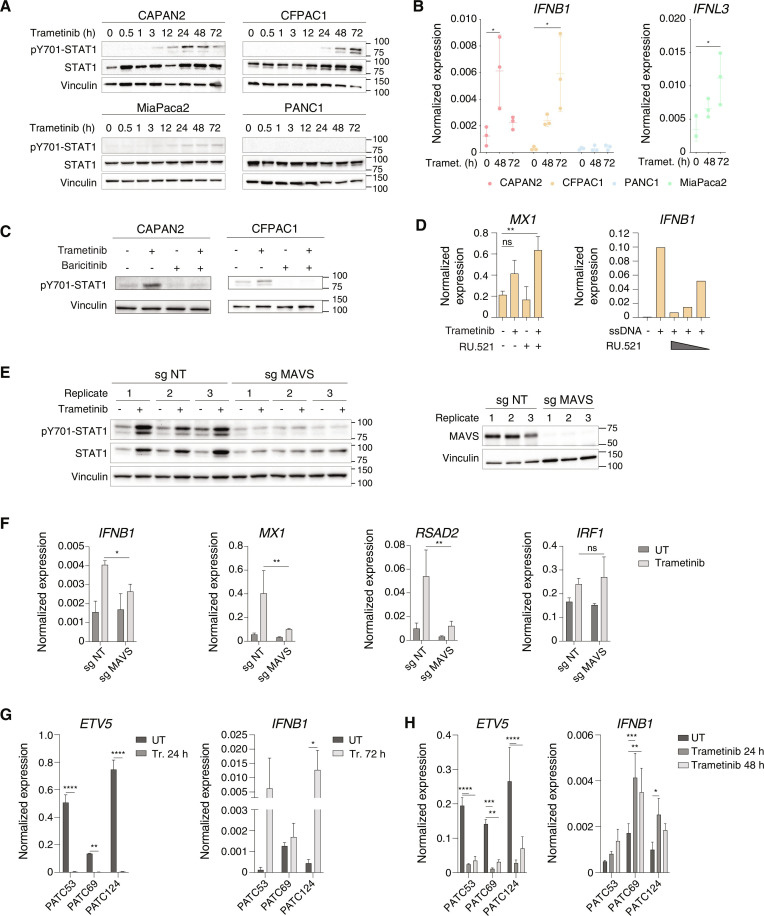
Fig. 2. MAVS requirement for the induction of the IFN response by trametinib.
(A) pY701-STAT1 and total STAT1 abundance in trametinib-treated PDAC cell lines. Vinculin: loading control. Representative of n = 3 independent experiments. (B) IFNB1 and IFNL3 mRNA abundance in PDAC cell lines after trametinib treatment. Values represent 2−ΔCq relative to the C1ORF43 reference gene. n = 3 biological replicates. Means ± SD are shown. Significance was assessed using one-way ANOVA (*P ≤ 0.05). (C) pY701-STAT1 abundance in low-grade PDAC cell lines after treatment with trametinib and/or baricitinib (72 hours). Representative of n = 3 independent experiments. (D) Left: MX1 gene expression in CFPAC1 cells after treatment with trametinib and/or RU.521 (72 hours). Values represent 2−ΔCq relative to C1ORF43. n = 3. Means ± SD are shown. One-way ANOVA (ns P > 0.05, **P ≤ 0.0). Right: IFNB1 mRNA abundance in CFPAC1 cells after transfection with ssDNA and treatment with RU.521 (6 hours). Values represent 2−ΔCq relative to C1ORF43. (E) Effects of MAVS gene inactivation on trametinib-induced pY701-STAT1. Left: pY701-STAT1 and total STAT1 abundance in CFPAC1 cells transduced with nontargeting or MAVS-targeting single-guide RNAs (sgRNAs) and treated with trametinib or vehicle (72 hours). Right: MAVS abundance in CFPAC1 infected with lenti-V2 expressing a nontargeting (NT) or a MAVS-targeting sgRNA (n = 3). (F) RT-qPCR analysis of IFNB1 and selected IFN-stimulated genes in CFPAC1 transduced with nontargeting (NT) or MAVS-specific sgRNAs (n = 3) after treatment with trametinib or vehicle (72 hours). Values represent 2−ΔCq relative to C1ORF43. Means ± SD are shown. Two-way ANOVA (ns P > 0.05, *P ≤ 0.05, **P ≤ 0.01). (G) ETV5 and IFNB1 mRNA abundance in primary PDAC cell lines in vitro upon trametinib treatment. Values represent 2−ΔCq to C1ORF43. n = 3. Means ± SD are shown. Two-way ANOVA (*P ≤ 0.05, **P ≤ 0.01, ****P ≤ 0.0001). (H) ETV5 and IFNB1 mRNA abundance in mouse xenografts of primary human PDAC cell lines before or after treatment with trametinib. Values represent 2−ΔCq versus C1ORF43. n = 3. Means ± SD are shown. Two-way ANOVA (*P ≤ 0.05, **P ≤ 0.01, ***P ≤ 0.001, ****P ≤ 0.0001).

