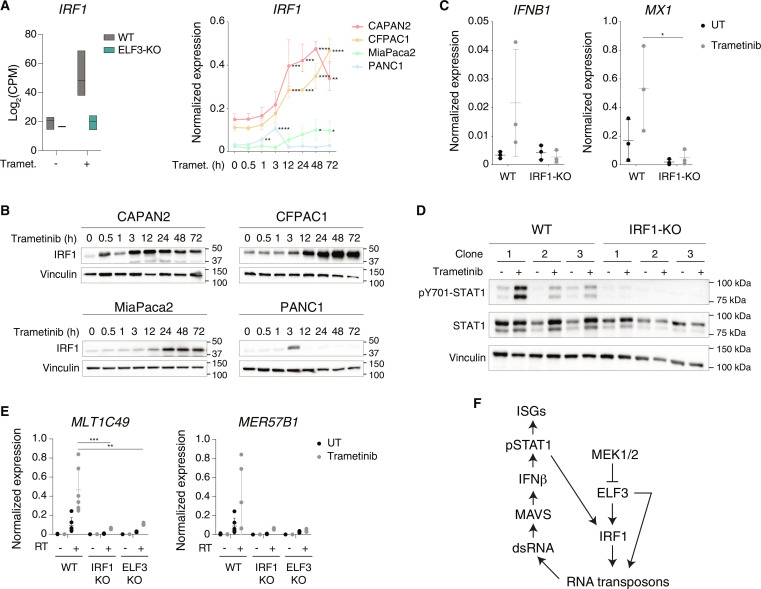
Fig. 6. An ELF3-IRF1 feed-forward loop in trametinib-induced viral mimicry.
(A) Induction of IRF1 expression by trametinib. Left panel: RNA-seq data counts showing the expression of IRF1 in WT and ELF3-null CFPAC1 cells after treatment with trametinib for 24 hours. Data are reported as the log of CPM after TMM normalization with EdgeR. Right panel: IRF1 expression was measured by RT-qPCR in low- and high-grade PDAC cell lines treated with trametinib. Values represent 2−ΔCq relative to C1ORF43. n = 3 biological replicates. Means ± SD are shown. Significance was assessed using one-way ANOVA and indicated as follows: *P ≤ 0.05, **P ≤ 0.01, ***P ≤ 0.001, ****P ≤ 0.0001. (B) IRF1 abundance in low- and high-grade PDAC cell lines after trametinib treatment. Vinculin is shown as loading control. The panel is representative of n = 3 independent experiments. (C) Expression of the IFNB1 and MX1 genes was measured by RT-qPCR in WT or IRF1-null CFPAC1 clones (n = 3) treated with trametinib or vehicle for 72 and 24 hours, respectively. Values represent 2−ΔCq relative to C1ORF43. Means ± SD are shown. Significance was assessed using two-way ANOVA and indicated as follows: *P ≤ 0.05. (D) pY701-STAT1 and total STAT1 abundance in WT and IRF1-null CFPAC1 clones (n = 3) after treatment with trametinib or vehicle for 72 hours. Vinculin is shown as loading control. Molecular weight markers are indicated on the right. (E) Expression of selected ERVs was measured by RT-qPCR in WT (n = 6), IRF1-null, and ELF3-null CFPAC1 clones (n = 3) after treatment with trametinib or vehicle for 24 hours. Values represent 2−ΔCq relative to C1ORF43. Means ± SD are shown. Significance was assessed using two-way ANOVA and indicated as follows: **P ≤ 0.01, ***P ≤ 0.001. RT-minus controls are shown to exclude amplification of repeats in genomic DNA. (F) Schematic model of the regulatory network controlling induction of retroelements in trametinib-treated PDAC cells.

