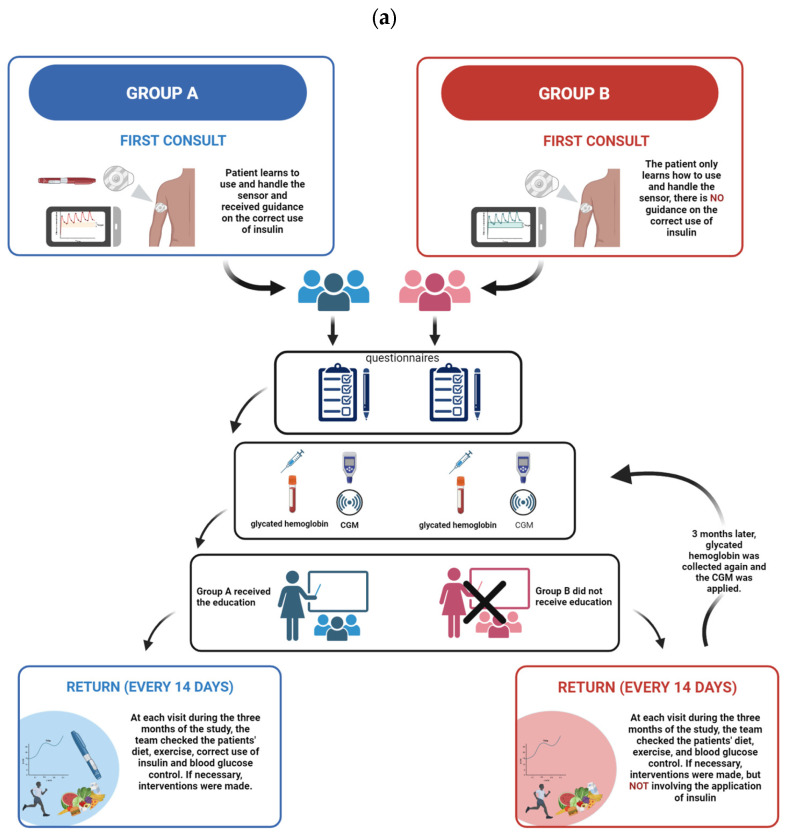
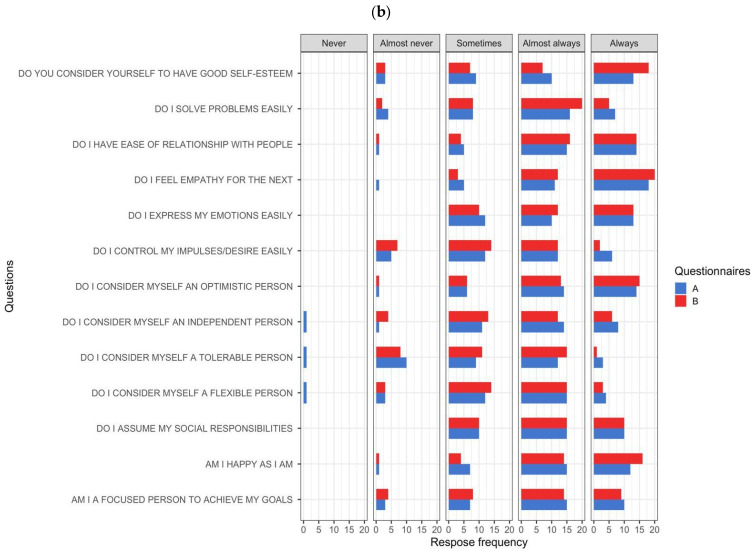
Figure 1.
(a) Representation of the groups studied in the research: group A (blue) and group B (red) and the organization of the study; (b) Frequency of responses from group A (blue) and group B (red) participants. On the left are the questions proposed by the questionnaire. Above, “Never”, “Almost never”, “Sometimes”, “Almost always” and “Always” represent the different levels of agreement and disagreement for the question.


