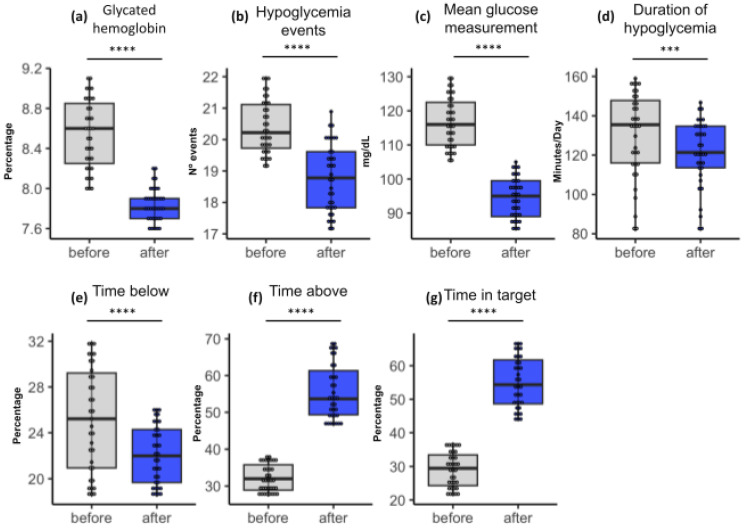
Figure 2.
Group A boxplots showing statistical results among paired samples. The blue color in the box represents the values observed in the last check. The upper and lower limits of the boxes, in blue, indicate the result range. The horizontal line inside each box indicates the median. The vertical lines indicate the outliers. The asterisks indicate significance (*** = 0.01; **** = 0.001). The significance presented refers not only to the p-value but also to the False Discovery Rate (FDR) in the pairing.

