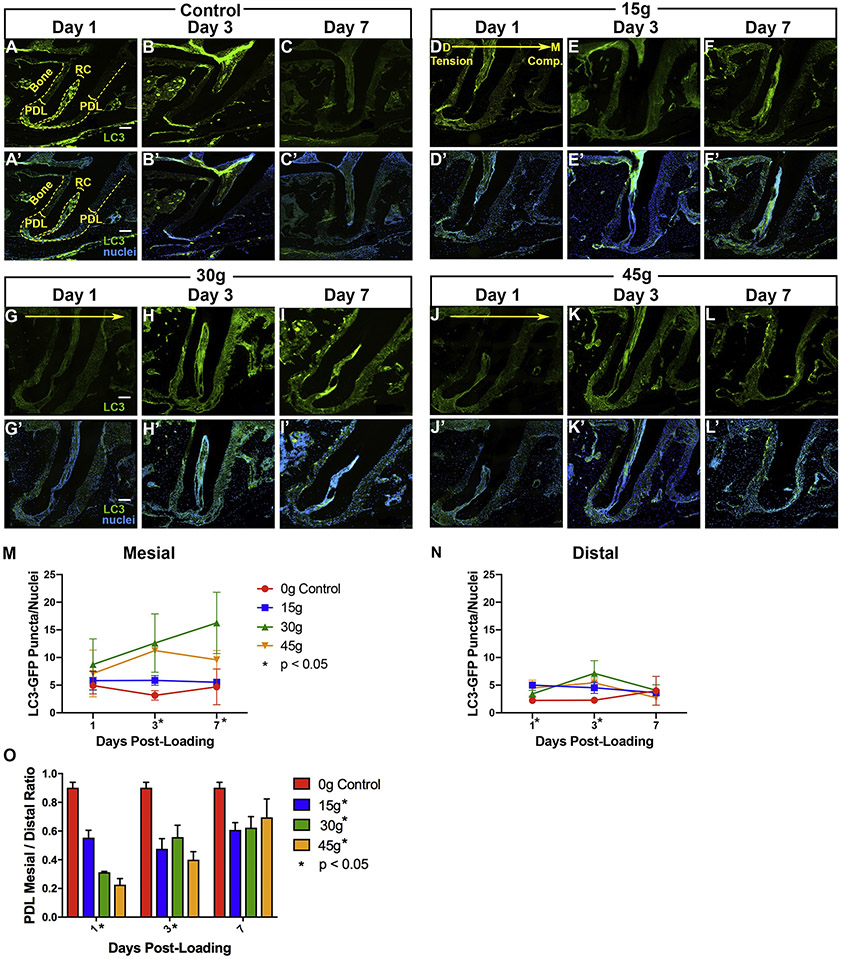
Figure 2. Orthodontic loading activates autophagy but varies by force level.
[A-L’] Nikon fluorescent microscope imaged sections of first molar distal roots from GFP-LC3 mice post-loading. [A-L] Green: GFP-LC3, Scale = 100 μm; [A’- L’] Green: GFP-LC3; Blue: DAPI nuclei, Scale = 100 μm. [D-L’] Experimental: Mesial, compression- right. Distal, tension- left. [D, G, J] Large yellow arrow indicates direction of force application with compression/mesial on the right and tension/distal on the left. PDL: Periodontal ligament. RC: root canal. Bone: alveolar bone. Yellow dashed lines- the outer lines the edge of the alveolar bone and the inner lines the root canal. [M-N] Quantification of autophagosome puncta / DAPI nuclei versus days post-loading in PDL of control (0g) and loaded (15g, 30g, 45g) molars on the mesial (M) and distal (N) sides of the root. Fluorescent puncta were quantified in a uniform (300l x 300 ul) area. Statistical significance (p< 0.05) is indicated by an asterisk next to the timepoint, when there were significant differences between all groups at that time point, and by an asterisk next to the force level, when there were significant trends over time within a force group. Graphs display the mean and SEM. Convention: * p<0.05. [O] Quantification of PDL dimension mesial / distal ratio versus days post-loading of control (0g) and loaded (15g, 30g, 45g) molars.

