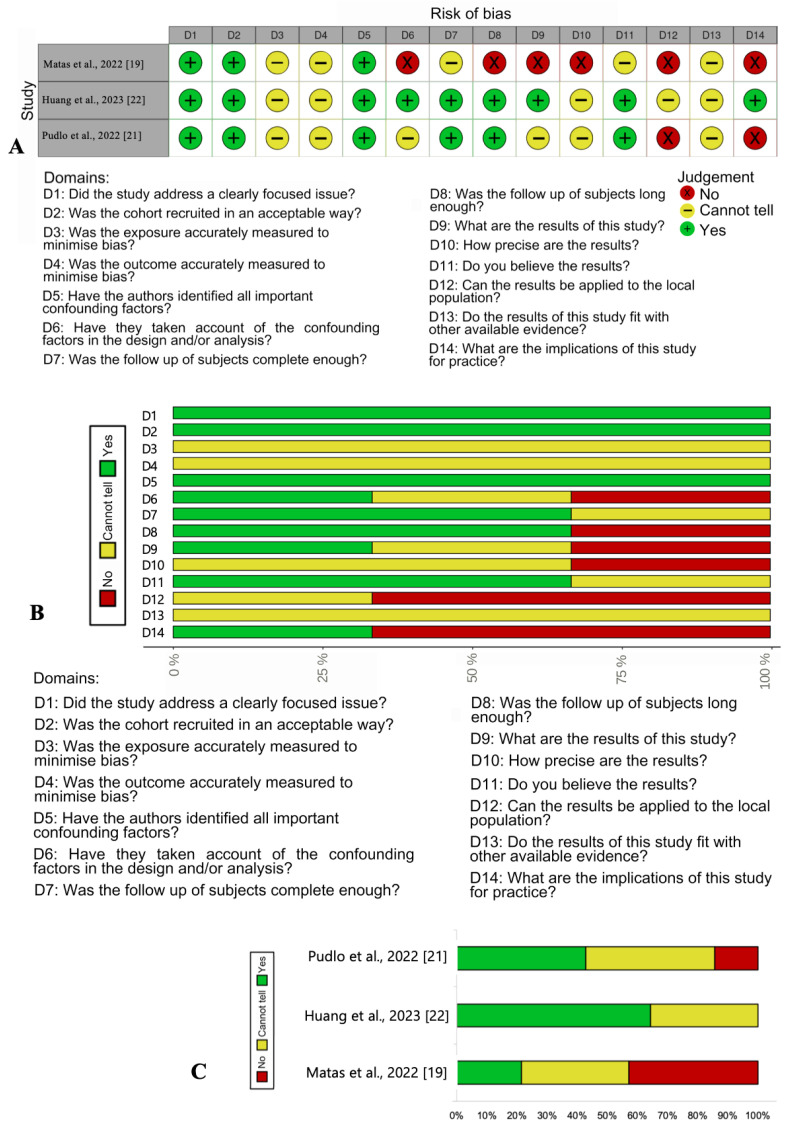
Figure 2.
Risk of bias in cohort studies: [19,21,22]. (A) Traffic light plot of the summary of the authors’ judgments about risk of bias items for each included cohort study. (B) Risk-of-bias graph: The authors’ judgments regarding each risk-of-bias item presented as percentages across all included studies. (C) Risk-of-bias graph: summary of the total percentage assessment of all risk of bias elements for each study separately.

