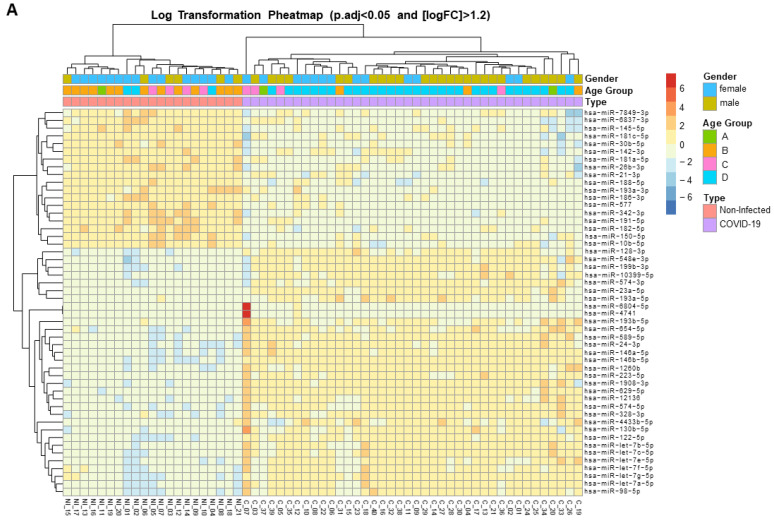
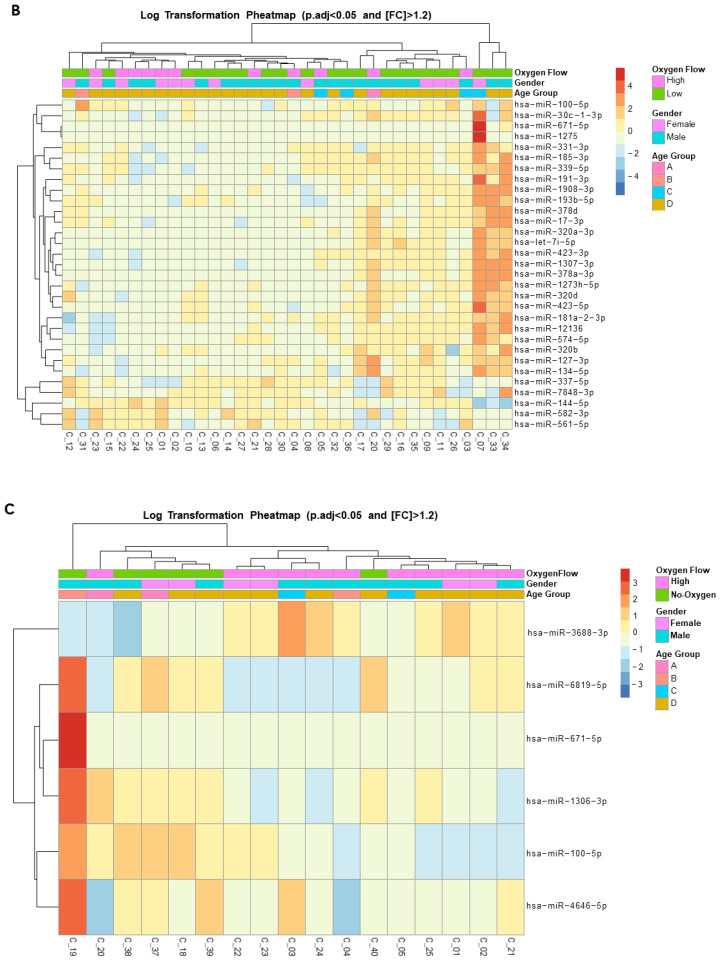
Figure 2.
Expression heat map of deregulated miRNAs in the plasma of hospitalized patients with SARS-CoV-2 acute infection. (A) Heat map of the top-50 differentially expressed (DE) miRNAs from SARS-CoV-2-infected patients. (B) Heat map of the 31 DE miRNAs between patients with SARS-CoV-2 who required high-flow or low-flow oxygen support. (C) Heat map of the 6 DE miRNAs between SARS-CoV-2 patients requiring high-flow oxygen or no oxygen support. Heat maps show the miRNAs with significantly (fold change [FC] > 1.2 and adjusted by gender and age p [padj] < 0.05) different levels. Red: upregulated miRNAs; blue: downregulated miRNAs; yellow: no change.


