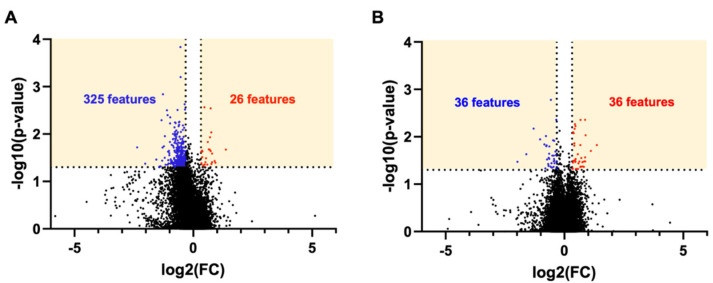
Figure 2.
Volcano plot of all features detected by LC-MS. (A) 3X vs. sham control. (B) 1X vs. sham control. The numbers correspond to features that were both statistically significant p < 0.05 and had 1.25-fold change. Blue denotes decrease and red denotes increase. Statistical analysis: The p-values were calculated by ANOVA and TukeyHSD-post hoc by Compound Discoverer among all three groups (sham vs. 1X, sham vs. 3X, 1X vs. 3X). The p-values from these calculations were extracted for the volcano plots.

