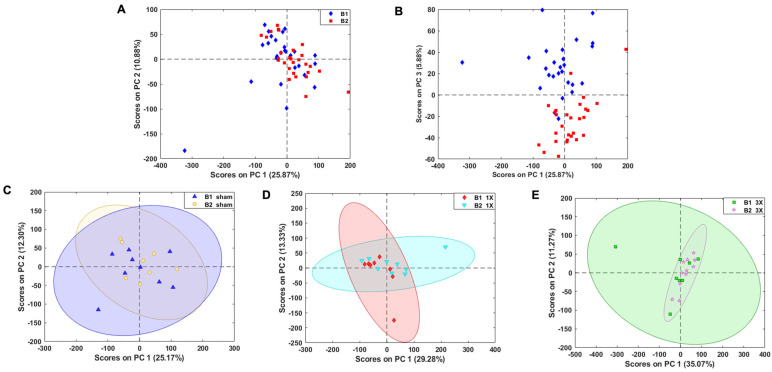
Figure 4.
19,411 features remained after feature reduction of batch effects. (A) PCA score plot of reduced features depict negligible separation of batches along PC1 and PC2. (B) PCA score plot of 19,752 features show separation of batches along PC3. PCA score plot depicting overlap of confidence ellipses between (C) sham control batches (D) 1X batches and (E) 3X batches. B1 denotes batch 1 and B2 denotes batch 2.

