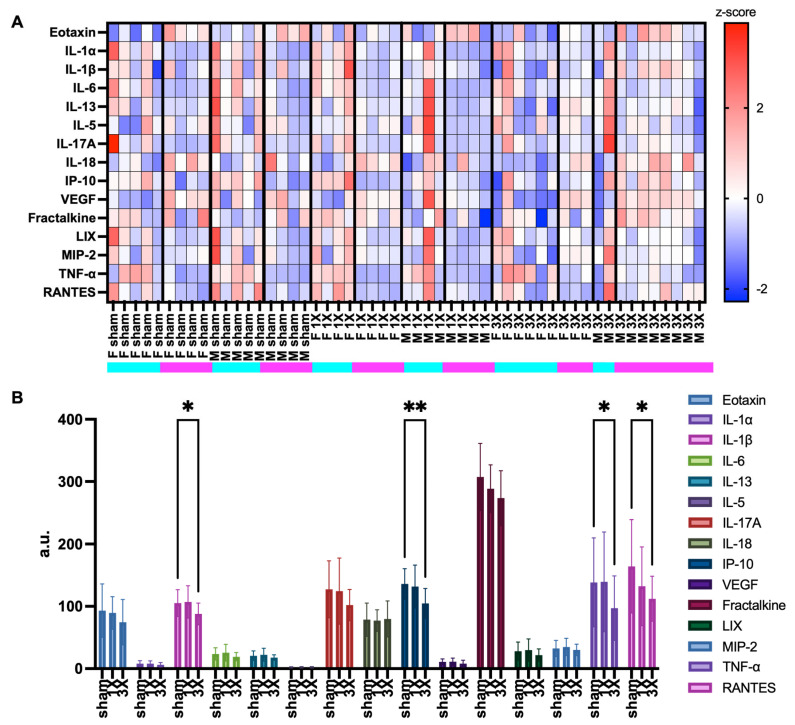
Figure 6.
Chemokine and cytokine inflammation marker profiles. (A) Heatmap of cytokine and chemokine expression z-score values. Rows are z-scored. (B) Levels of chemokine and cytokine markers in the brain cortices. Graph denotes mean and standard error of mean (SEM). Statistical analysis, Mixed-effect analysis, and Tukey’s post hoc test. *, p < 0.05; **, p < 0.01.

