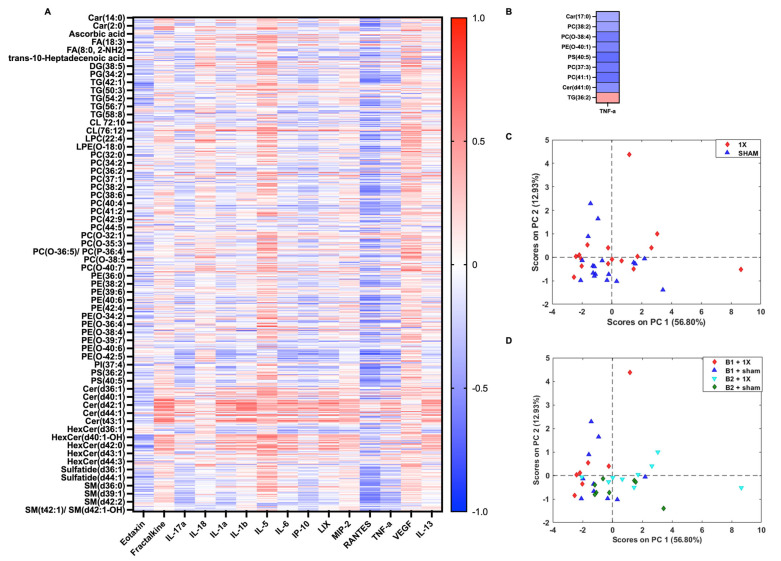
Figure 8.
Correlation between annotated lipids and cytokines following 1xmTBI (A) Spearman correlation matrix of 52 annotated lipids and 1 cytokine. Heatmap denotes the median values of each injury group. (B) PCA score plot of lipids that depicts a slight shift along the diagonal of PC1 and PC2 between sham and 1X samples. (C) PCA score plot of 9 lipids depicting sham control and 3X injury groups. (D) PCA score plot of 9 lipids depicting experimental batches and injury severity.

