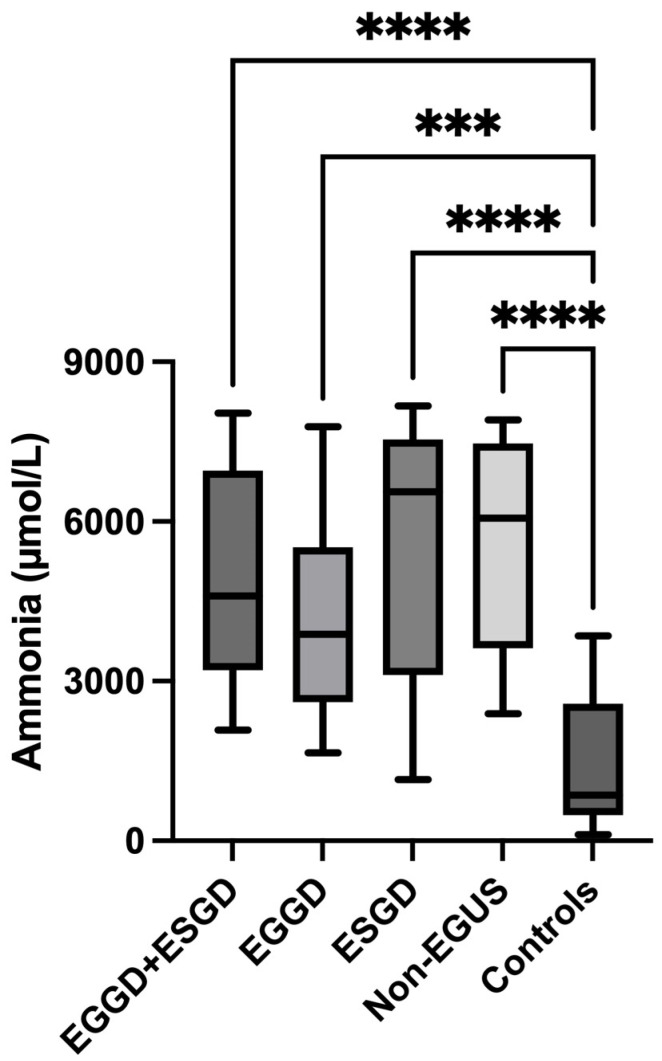
Figure 5.
Comparison of ammonia concentrations in the saliva of horses with Equine Glandular Gastric Disease (EGGD) and Equine Glandular Gastric Disease (ESGD) at the same moment (EGGD + ESGD), horses with only EGGD, horses with only ESGD, horses with gastrointestinal signs but negative to Equine Gastric Ulcer Syndrome (Non-EGUS), and healthy horses (Controls). The median values are represented by the lines, the 10–90 percentiles by the boxes and the range by the whiskers. *** p < 0.001, **** p < 0.0001.

