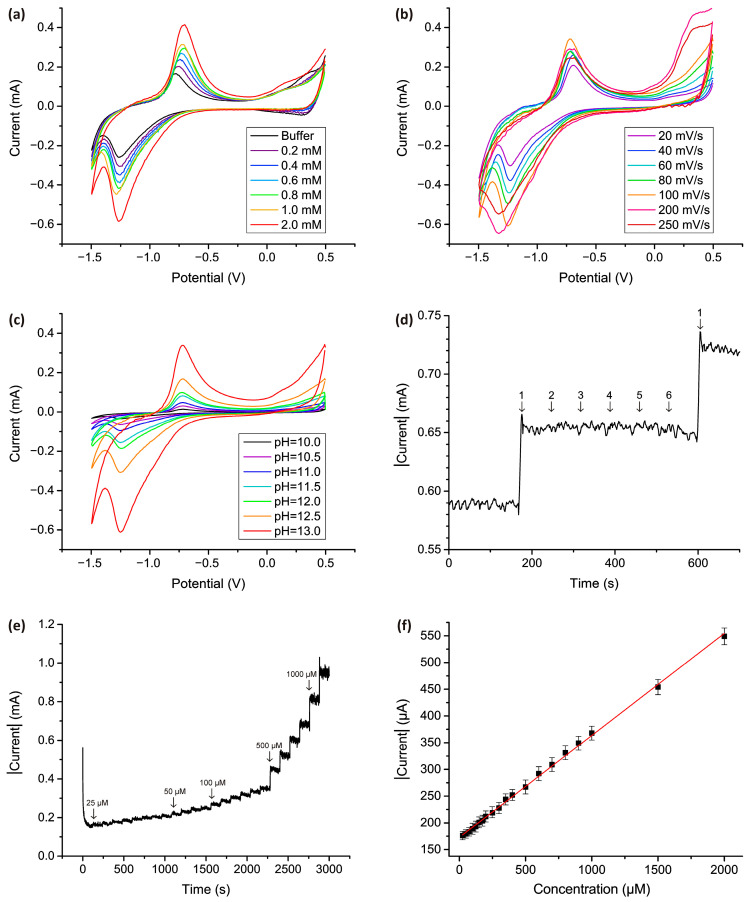
Figure 6.
(a) CV graph of nanostructured Co3O4 electrode obtained in a 0.1 M supporting electrolyte and in solutions containing supporting electrolyte and a number of H2O2 concentrations from 0.2 mM to 2 mM. (b) Comparison of CV graphs obtained at different scan speeds. Scanning was performed in a 0.1 M NaOH solution containing 5 mM H2O2. (c) CV measurements performed at different pH values of supporting electrolyte containing 5 mM H2O2. Scanning was carried out in different concentrations of NaOH solution containing 5 mM H2O2 at a scanning rate of 100 mV·s−1. (d) Interference study with the addition of H2O2 (1) and potential interferents NaCl (2), KNO3 (3), glucose (4), citric acid (5), and ascorbic acid (6). (e) Chronoamperograms obtained in a 0.1 M NaOH supporting electrolyte for Co3O4 nanostructured electrode for −1.2 V peak potential obtained by adding H2O2 in the concentration range from 25 μM to 5 mM. (f) Calibration graph for concentration-current dependence.

