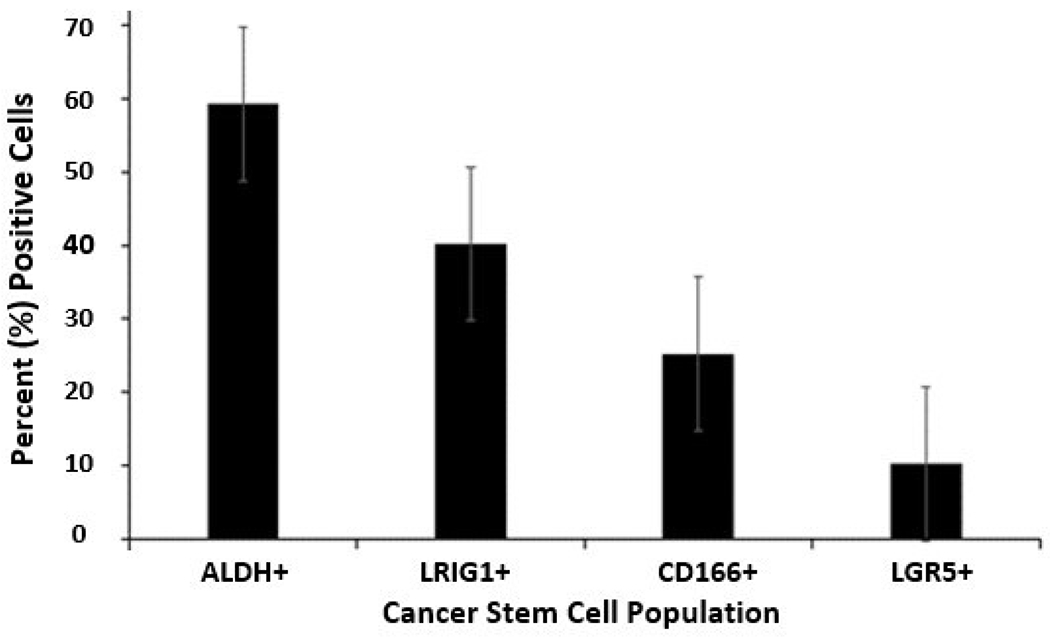
Figure 1:

Proportion of different CSC populations in the HT29 CRC cell line. The bar graph gives the percent ALDH+, LRIG1+, CD166+ and LGR5+ cells in the HT29 CRC cell population as determined by flow cytometric analysis. Error bars represent standard error of the mean (n=3-7 experimental replicates per marker).
