Figure 2c:

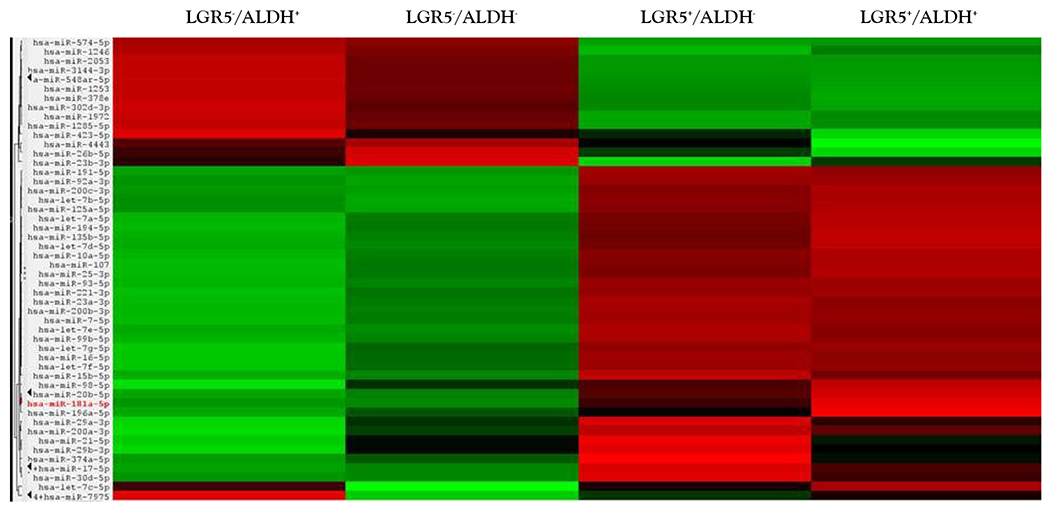
Gives a heat map from Nanostring profiling analysis showing differential expression of the top 50 miRNAs in the four different isolated CSC subpopulations (increased expression = green; decreased expression = red for each CSC marker).

Gives a heat map from Nanostring profiling analysis showing differential expression of the top 50 miRNAs in the four different isolated CSC subpopulations (increased expression = green; decreased expression = red for each CSC marker).