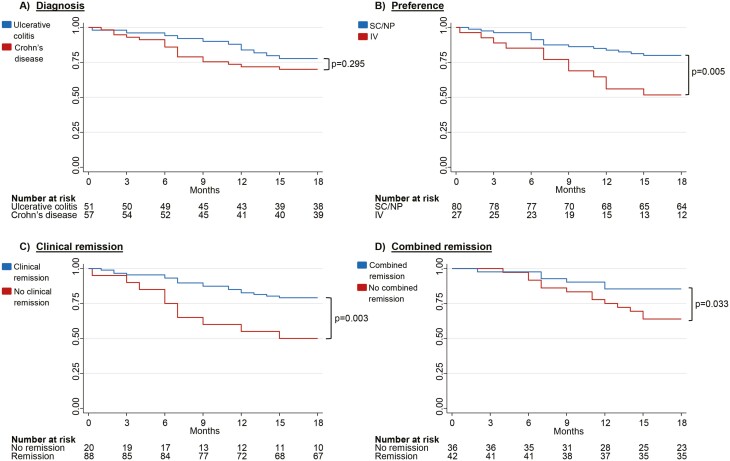
Figure 2.
Kaplan Meier Survival Curves for continuing subcutaneous (SC) vedolizumab (VDZ) with 18-month follow-up. The Y-axis depicts the cumulative probability of continuing on SC VDZ. The X-axis depicts time from switch to 18 months. (A) Kaplan–Meier drug persistence curve stratified by diagnosis. (B) Kaplan–Meier drug persistence curve stratified by preference at switch (no preference or SC preference versus IV preference) (C) Kaplan–Meier drug persistence curve stratified by clinical remission and no clinical remission at switch. Clinical remission is defined as Harvey Bradshaw Index ≤ 4 for Crohn’s disease and Partial Mayo Score without physician's assessment ≤ 1 for Ulcerative colitis. D) Kaplan Meier drug persistence curve stratified by combined remission and no combined remission at switch. Combined remission is defined as clinical remission and C-reactive protein < 5 mg/L and Fecal Calprotectin < 250 mg/kg. SC, subcutaneous; NP, No preference; IV, intravenous.

