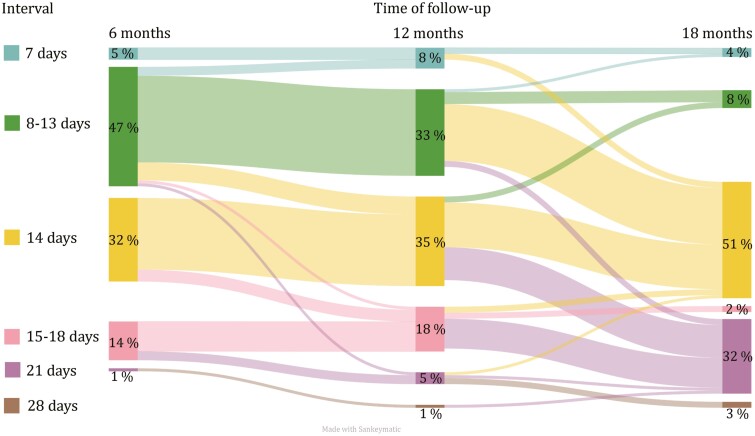
Figure 4.
Distribution of dosing intervals at 6, 12, and 18 months follow-up. The diagram demonstrates the flow of patients who changed intervals between the different time-points. Intervals displayed are 7, 8–13, 14, 15–20, 21, and 28 days. Percentages describe proportion of patients in each group during the 3 time points.

