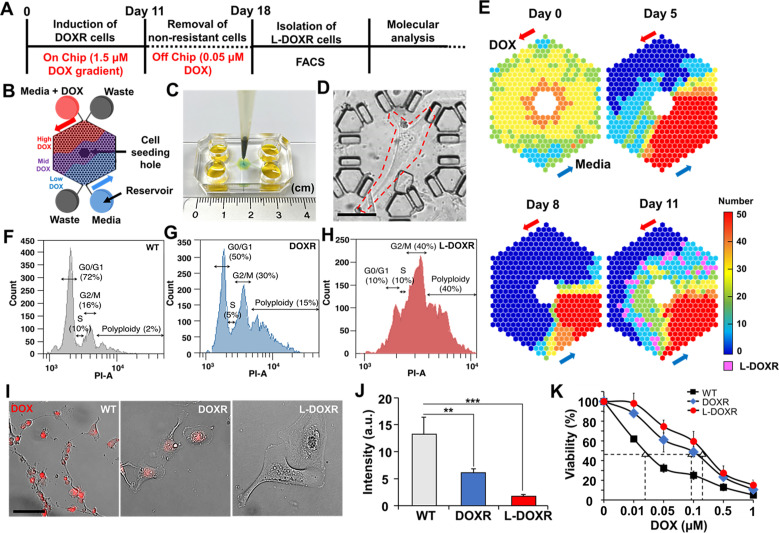
Figure 2. Tracking DOXR and L-DOXR cells induced by a DOX concentration-gradient in the CDRA chip and their cell cycle and drug resistance.
(A) Experimental design. (B) Schematic of the chip. (C) Image of the CDRA chip. (D) L-DOXR cells (red dotted line) induced in the CDRA chip. (E) Tracking the number of live cells in each chamber of the chip for 11 days. L-DOXR cells are observed in some of the pink chambers on day 11. FACS analysis was used to assess the cell cycle of (F) WT cells, (G) DOXR cells, and (H) L-DOXR cells. (I) Red fluorescent intensity of WT cells, DOXR cells, and L-DOXR cells. Scale bar = 100 μm. (J) DOX efflux ability of WT cells, DOXR cells, and L-DOXR cells. **p<0.01, ***p<0.001, two-tailed Student’s t-test. (K) DOX sensitivity of WT cells (The half-maximal inhibitory concentration (IC50)=25 nM), DOXR cells (IC50=100 nM), and L-DOXR cells (IC50=200 nM).

