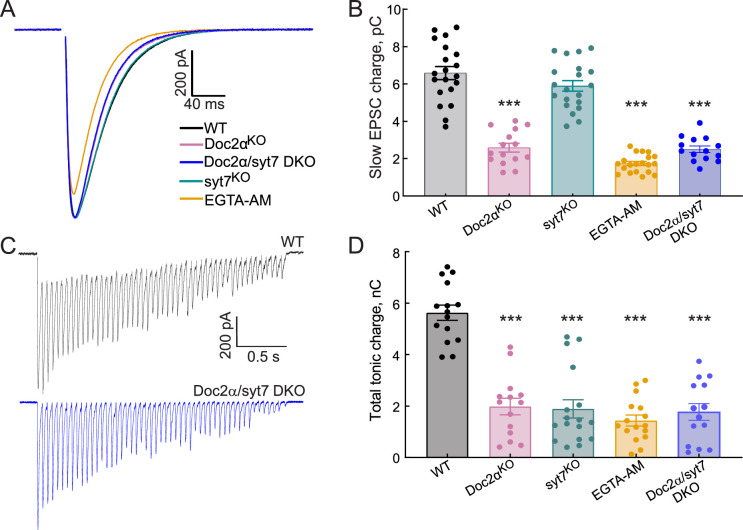
Figure 8. Asynchronous release (AR) in Doc2α/syt7 double knockout (DKO) neurons: non-additive effects on AR indicate function through a common pathway.
All recordings were carried out using acute hippocampal slices, in CA1, as described in Figures 2 and 4. Data from all conditions except Doc2α/syt7 DKO are the same as shown in Figures 2 and 4 and. (A) Averaged traces of evoked excitatory postsynaptic currents (EPSCs) recorded from WT (n = 18 recordings; from five independent litters), Doc2αKO (n = 15; from four independent litters), Doc2α/syt7 DKO (n = 14; from four independent litters), and EGTA-AM-treated neurons (n = 20; from four independent litters). (B) Bar graph summarizing the slow EPSC charge values. Error bars are mean ± the standard error of the mean. One-way ANOVA, followed by Dunnett's test, was used to compare mutants against WT. ***p<0.001. Exact p-value for slow EPSC charge in syt7 KO = 0.43. (C) Representative EPSCs triggered by 20 Hz stimulus trains using WT and Doc2α/syt7 DKO (n = 15 recordings; from five independent litters) neurons. (D) AR in WT, Doc2αKO, syt7KO, Doc2α/syt7 DKO, and EGTA-AM-treated neurons was estimated by measuring the total tonic charge transfer during the 20 Hz stimulus train, as described in Figure 4C. Error bars are mean ± the standard error of the mean. One-way ANOVA, followed by Dunnett's test, was used to compare mutants against WT. ***p<0.001. All data, summary statistics, and p-values are listed in Figure 8—source data 1.
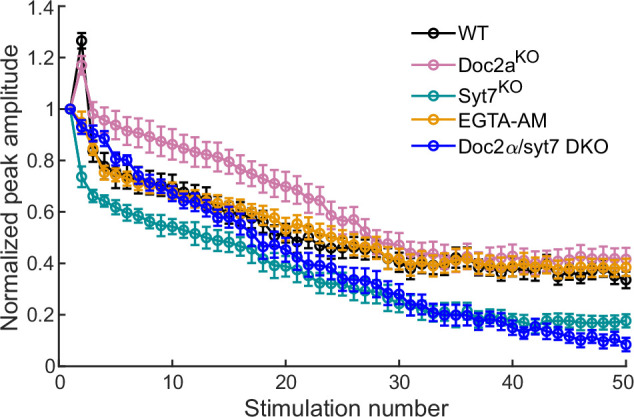
Figure 8—figure supplement 1. EGTA-AM phenocopies synaptic depression of phasic responses in Doc2α/syt7 double knockouts (DKOs), an intermediate phenotype between the single KOs.


