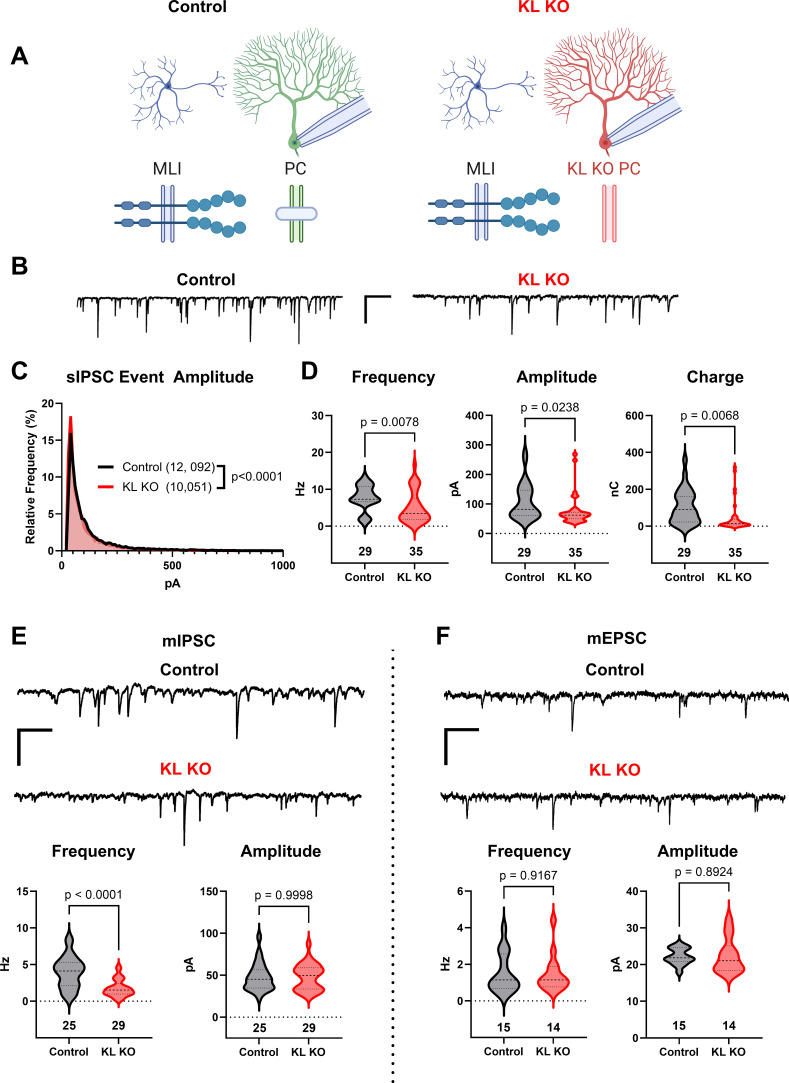
Figure 3. Knockout of Kit Ligand (KL KO) from Purkinje cells decreases the inhibitory input they receive.
(A, B) Experimental schema and example traces of inhibitory postsynaptic currents detected in PCs from Control animals or from those with KL KO accomplished by a Pcp2-Cre × KL (Kitl) floxed strategy. Scale bar is 500 ms × 100 pA. (C) A frequency distribution plot for individual spontaneous inhibitory postsynaptic current (sIPSC) event amplitudes recorded in PCs as in (A, B). A KS test reveals a significant difference in the distribution of these event amplitudes; p < 0.0001, n in chart. (D) For each PC, the average sIPSC frequency and amplitude, and the total inhibitory charge transfer, was determined. There was a significant ~40% decrease in sIPSC frequency, amplitude, and charge transferred to KL KO PCs. (E, F) The average miniature inhibitory postsynaptic currents (mIPSC) recorded in PC KL KO vs Control PCs had a > 50% decreased frequency p < 0.0001 without a corresponding decrease in amplitude. The average miniature excitatory postsynaptic current (mEPSC) frequency and amplitude recorded in separate PCs did not differ between Control and KL KO. Scale bar is 500 ms × 100 pA for mIPSC, 500 ms × 50 pA for mEPSC. n in charts refers to the number of cells. Error bars are SEM. p-Values were calculated by a two-tailed t-test, with Welch’s correction as needed.
© 2024, BioRender Inc
Figure 3 was created using BioRender, and is published under a CC BY-NC-ND license. Further reproductions must adhere to the terms of this license.

