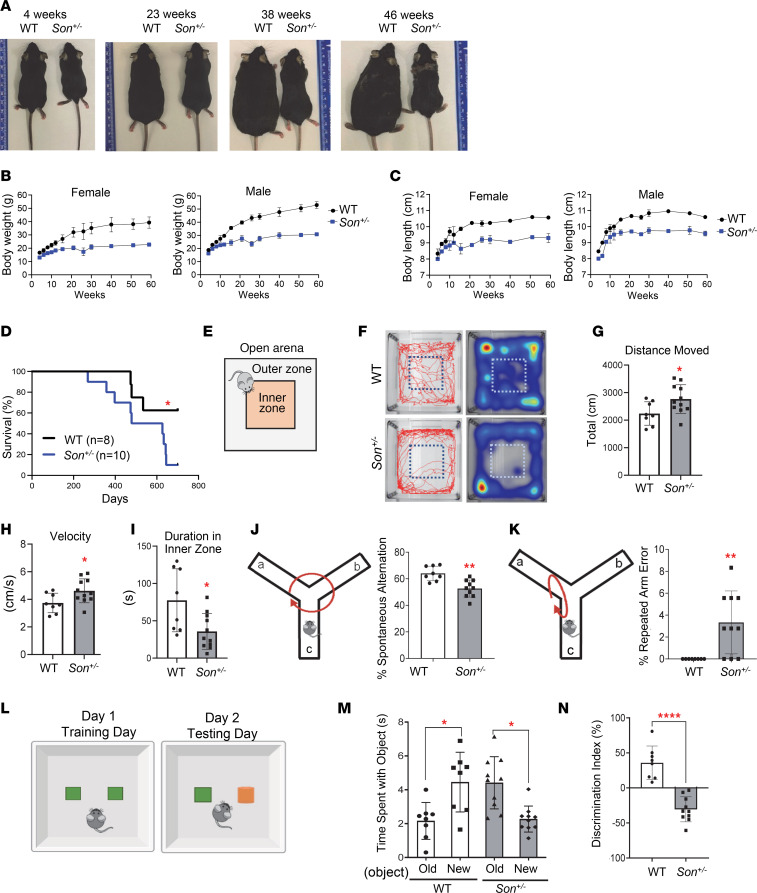
Figure 2. Son+/– mice show growth retardation, weight gain failure, and behavioral phenotypes, resembling clinical features of human ZTTK syndrome.
(A) Representative images indicating body size differences between WT and Son+/– mice at various ages. (B and C) The body weight (B) and the body length (C) of female and male mice were measured at different ages up to 60 weeks. Data are presented as mean ± SD, n = 5–12. (D) Kaplan-Meier curves of survival data in Son+/– mice compared with WT with a follow-up duration of 700 days of age; *P < 0.05 by log-rank test. (E) Schematic depicting the open field test. (F) Representative tracks of WT and Son+/– showing the total distance traveled by the indicated mouse and the representative heatmaps of time the mouse spent in the open arena. (G) The total distance moved was calculated by measuring the total centimeters traveled. (H) Velocity was calculated by measuring centimeters traveled per second (cm/s). (I) Time (seconds) spent in the inner zone of the open area. (J and K) Schematics and the graphs of percentage level showing correct spontaneous alternation (J) and incorrect spontaneous alternation, also called repeated arm error (K), of WT and Son+/– mice in the Y-maze test. (L) Schematic depicting the experimental design of the novel object recognition test. Old object, depicted in green; new object, depicted in orange. (M) Time spent with the old versus new object was calculated in seconds. (N) A discrimination index was calculated using the percentage of the ratio between the time spent (T) per exploration number (N) of the novel object by the time spent per exploration number of both objects (Tnew/Nnew – Told/Nold/Tnew/Nnew + Told/Nold). For graphs in G–K, M, and N, data are presented as mean ± SD, n = 8–10 per group. *P ≤ 0.05, **P < 0.01, ****P < 0.0001 by 2-tailed t test.

