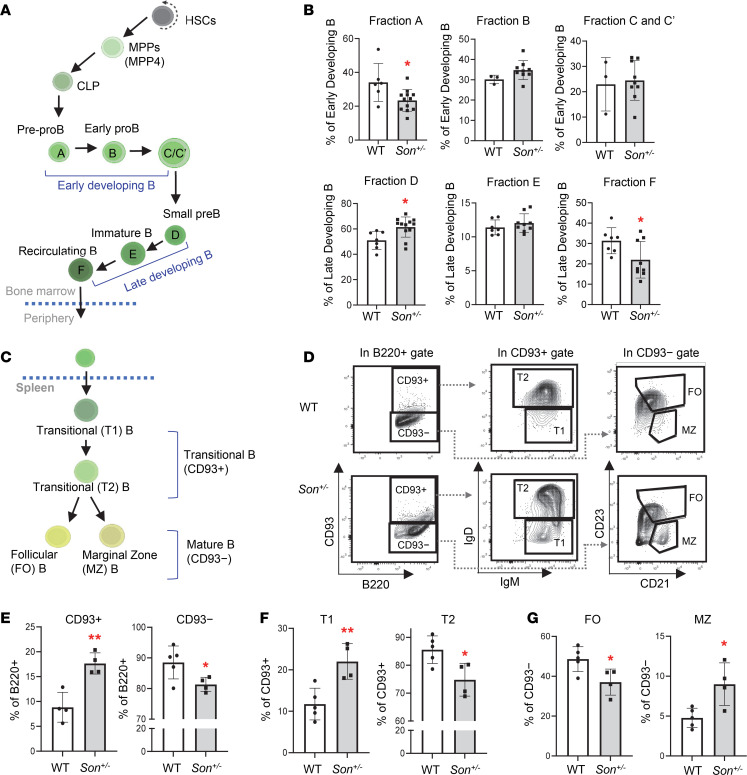
Figure 6. Son haploinsufficiency causes impaired B cell differentiation in the spleen of Son+/– mice.
(A) A schematic depicting B cell development in the bone marrow. (B) Frequency of bone marrow B cell subsets (Hardy fractions) determined by flow cytometry analysis of surface markers. Data are expressed as mean ± SD, n = 3–12. *P < 0.05, by 2-tailed t test. (C) A schematic depicting B cell differentiation into transitional B and subsequently mature naive B cells in the spleen. (D) Flow cytometry contour plots demonstrating the gating scheme of CD93+ (transitional) and CD93− (naive mature) B cells within the spleen B220+ cell population, T1 and T2 transitional B cells within the CD93+ population, and FO and MZ B cells within the CD93− population. (E–G) Frequency of the indicated spleen B cell subsets, expressed as mean ± SD, n = 4–5, *P < 0.05, **P < 0.01 by 2-tailed t test.

