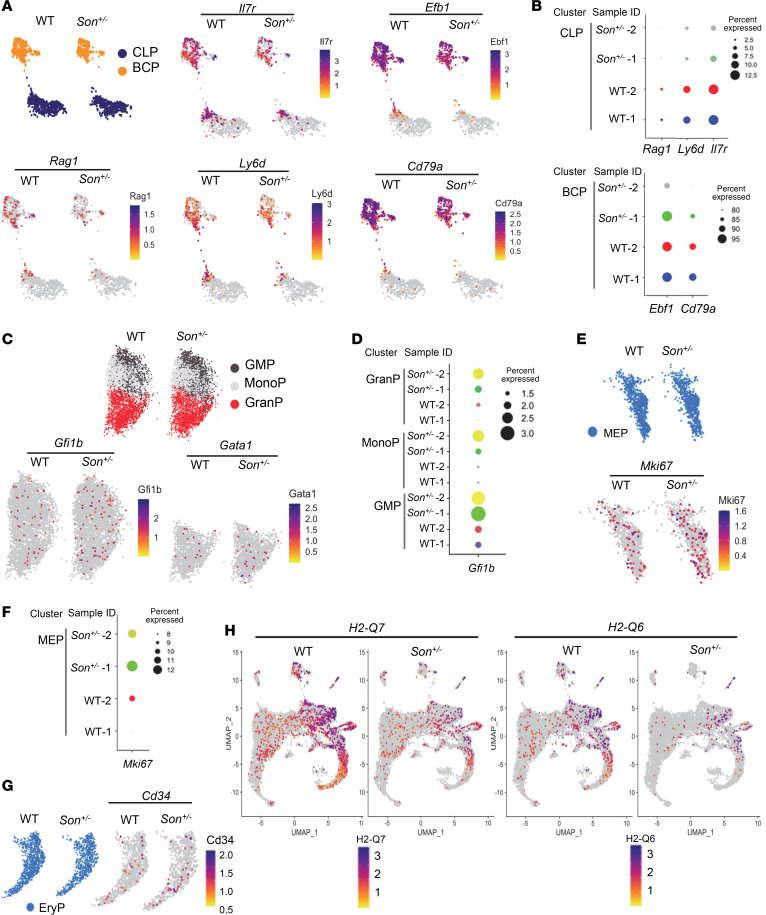
Figure 8. Differential gene expression analysis in hematopoietic progenitor clusters identified altered expression of genes critical for lymphoid/B cell lineage development and aberrant activation of myeloid lineage–regulating genes in Son+/– mice.
(A) Feature plots showing the common lymphoid progenitor (CLP) and B cell progenitor (BCP) clusters from WT and Son+/– mice and the expression distribution of indicated genes critical for lymphoid lineage specification and B cell development. (B) Dot plots visualizing the percentage of the cells expressing the indicated genes. The size of the dot encodes the percentage of cells within the cluster. (C and D) Feature plots (C) and dot plots (D) showing the granulocyte/monocyte progenitor (GMP), monocyte progenitor (MonoP), and granulocyte progenitor (GranP) from WT and Son+/– mice and the expression of the erythroid lineage transcription factors. (E and F) Feature plots (E) and dot plots (F) of megakaryocyte/erythroid progenitor (MEP) expressing MKi67. (G) Feature plots showing Cd34 expression in the erythroid progenitor (EryP) cluster. (H) Feature plots showing the expression levels of H2-Q7 and H2-Q6 genes in all clusters from WT and Son+/– mice. (A, C, E, G, and H) Expression levels for each cell are color-coded as indicated in the heatmap legend.

