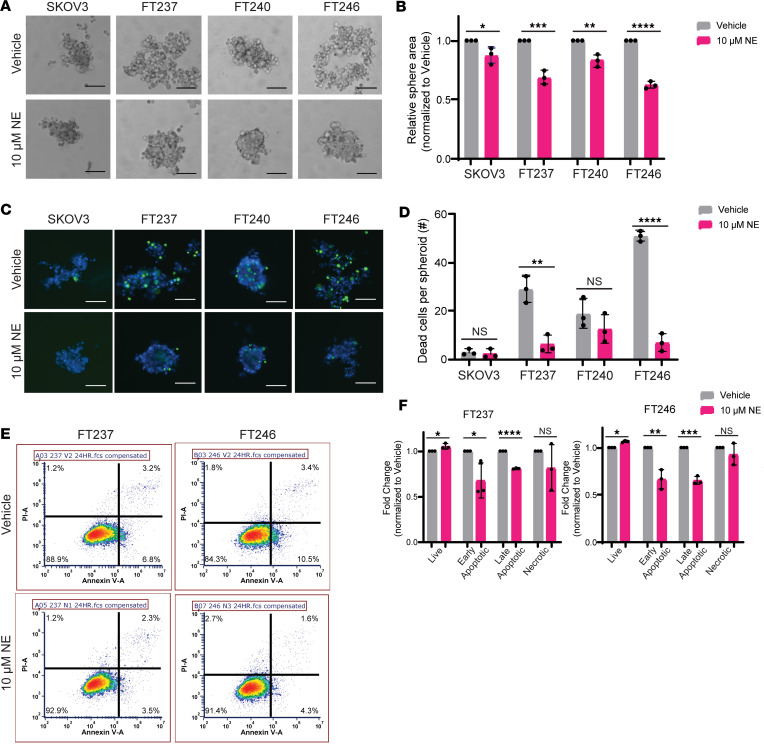
Figure 1. NE induces spheroid formation and anoikis resistance in FTE cells.
(A) Bright-field images of the HGSC cell line SKOV3 as well as 3 immortalized human FTE cell lines (FT237, FT240, and FT246) cultured under ultra-low-attachment (ULA) conditions for 24 hours with vehicle or 10 μM NE. (B) Fold-change in average area for NE-treated spheres relative to vehicle-treated spheres as visualized in A. (C) ReadyProbe viability staining of cells cultured as in A. These images were taken at 10× original magnification and scale bars represent 100 µm. (D) Absolute quantification of dead cells (shown in green in C) per spheroid (shown in blue in C). (E) Representative flow cytometry plots for propidium iodide + annexin V staining, with quantification of cell populations relative to vehicle-treated cells in F, as cultured in A. Each experiment was conducted in technical triplicate for each biological replicate (n = 3). All statistical analyses for this figure were conducted with Student’s t tests. Data are represented as mean ± standard deviation. *P < 0.05, **P < 0.01, ***P < 0.001, ****P < 0.0001.

