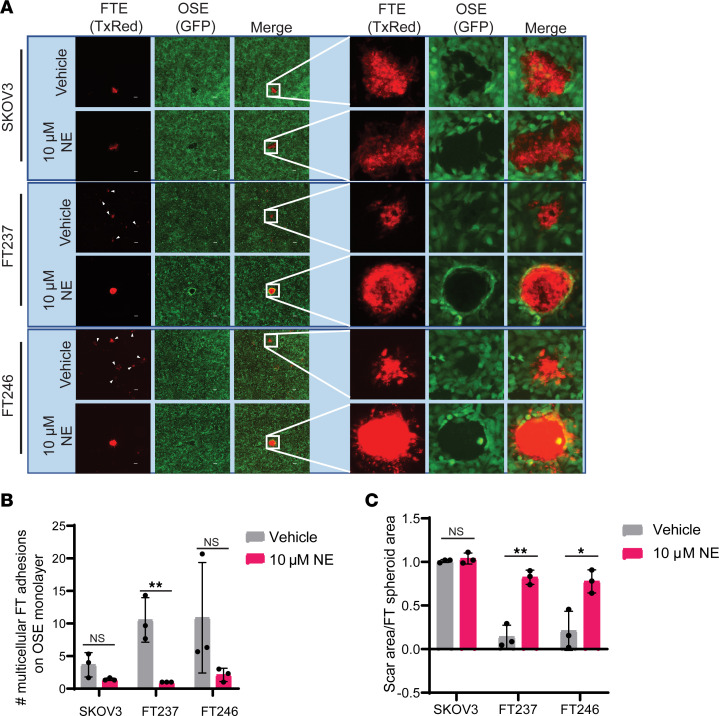
Figure 2. Viable FTE precursor spheroids adhere to and displace OSE.
(A) Fluorescence images after 24 hours of coculture with 2D immortalized human OSE cells (HIO80-L2G, green) and CellTracker Red–stained FTE cells that were pretreated in ULA culture for 24 hours ± 10 μM NE. These images were taken at 4× original magnification, and insets are uniformly magnified regions of interest. (B) Quantification of the number of multicellular FTE cell adhesions (TxRed) on the GFP+ OSE monolayer. (C) Quantification of scar area in the OSE monolayer relative to the area of the adhered FTE cells. Each experiment was conducted in technical triplicate for each biological replicate (n = 3). All statistical analyses for this figure were conducted with Student’s t tests. Data are represented as mean ± standard deviation. *P < 0.05, **P < 0.01.

