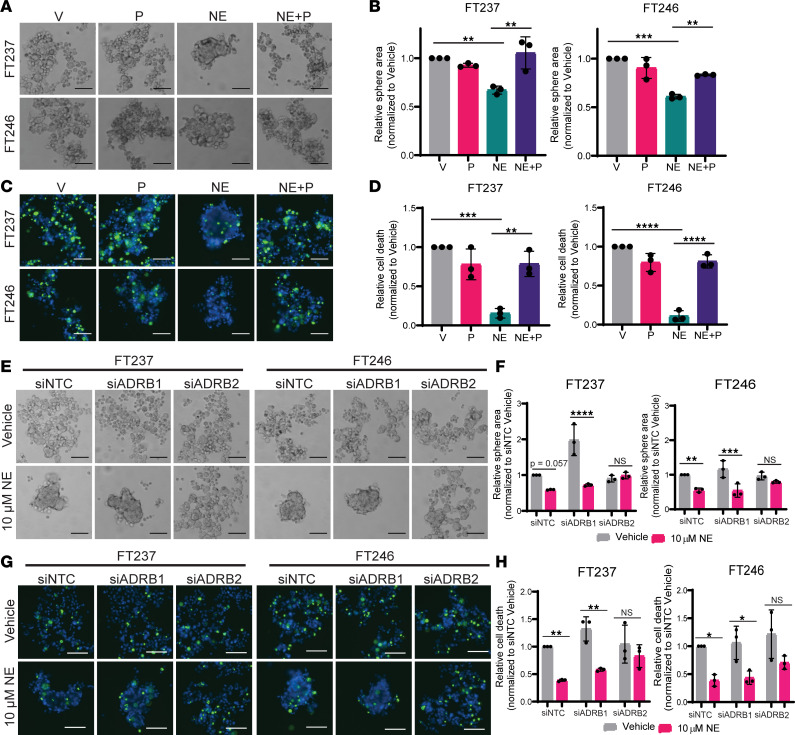
Figure 3. NE-induced anoikis resistance occurs in an ADRβ2-dependent manner.
(A and B) Bright-field images and relative area quantification of FTE spheres cultured in ULA culture for 24 hours ± 10 μM NE (V, NE, respectively) and/or nonselective beta blocker, propranolol (NE+P, P, respectively). (C and D) Fluorescence images of ReadyProbe viability staining for spheroids (blue) and quantification of dead cells (green) cultured as in A. (E) Bright-field images for FTE cells cultured in ULA plates ± 10 μM NE after transfection with siNTC, siADRβ1, or siADRβ2. (F) Quantification of NE-treated spheroid area relative to vehicle-treated cells. (G) Fluorescence images of ReadyProbe viability staining for spheroids (blue) and quantification of dead cells (green) (H) in each siRNA condition. These images were all taken at 10× original magnification and scale bars represent 100 µm. Each experiment was conducted in technical triplicate for each biological replicate (n = 3). Statistical analyses were conducted with (B and D) 1-way ANOVA with Tukey’s correction for multiple comparisons or (F and H) 2-way ANOVA with Holm-Šídák correction for multiple comparisons. Data are represented as mean ± standard deviation. *P < 0.05, **P < 0.01, ***P < 0.001, ****P < 0.0001.

